
ScalaHosting is one of the few hosts that didn't just resell someone else's stack — it built its own control panel (SPanel) and its own AI security layer (SShield), and it sells managed cloud VPS rather than crowded shared boxes. That's an interesting promise, so I put the entry-level plan through the same battery of tests I run on every host: three real WordPress sites, synthetic benchmarks, and proper k6 load tests. This review is built on those measurements, not on the marketing page.
What you'll learn in this review
- What ScalaHosting's managed cloud VPS is and what the tested plan costs
- SPanel — the in-house control panel — and how onboarding works
- SShield, the AI security layer that ships with every plan
- My test methodology (three sites + the tools I used)
- Measured results: WP Benchmark, PageSpeed Insights, SpeedTest Pro, Query Monitor
- Load tests (spike, ramp up/down, sustained) — the part that surprised me
- Tuned re-test on LiteSpeed + LSCache + Redis — the before/after on the P95 fix
- Strengths, weaknesses, who I'd recommend it to (and who I wouldn't)
- Final verdict with a category-by-category score
Why I tested it and what I expected
A managed cloud VPS sits between shared hosting and a raw VPS: you get dedicated resources and root-level capabilities, but the provider handles the server administration, security and a control panel so you don't have to live in a terminal. ScalaHosting leans hard on three differentiators — SPanel (a cPanel alternative with no per-account licensing), SShield (real-time AI security), and managed cloud infrastructure. I wanted to see whether the entry plan actually delivers usable performance and, crucially, how it behaves under sustained traffic — the test that has tripped up other hosts I've reviewed.
For context, ScalaHosting carries the kind of third-party validation that's worth a sentence: a 4.9/5 Trustpilot score across 2,000+ reviews, plus “best VPS/cloud hosting 2026” nods from Forbes, PCMag, TechRadar and CNET. Nice to have — but I care about my own numbers.
The service and the tested plan
ScalaHosting's Managed Cloud VPS line gives you a dedicated virtual server with SPanel, SShield, free SSL, daily backups, free migration and a 99.99% uptime SLA, all managed. The resources (CPU, RAM, NVMe/SSD) are configurable, and SPanel is included at no extra cost — there's no cPanel licence to pay per account.
I tested the Entry Cloud plan in the Sofia, Bulgaria data center (a European location, which matters for EU latency):
| Parameter | Tested: Entry Cloud |
|---|---|
| vCPU | 2 cores |
| RAM | 2 GB |
| Storage | 50 GB NVMe SSD |
| Data center | Sofia, Bulgaria (Europe) |
| Control panel | SPanel (included free) |
| Security | SShield (included free) |
| Price | $29.95/mo intro, renewing $54.95/mo (I was billed $119.85/quarter ≈ $39.95/mo) |
| Backups | Daily included; optional 3-day ($6) / 7-day ($15) retention |
| Extras | Free SSL, free migration, 99.99% uptime SLA, anytime money-back |
ScalaHosting's entry build is publicly priced at $29.95/mo on the introductory term, renewing at $54.95/mo (the $39.95/mo above is the quarterly-billing rate I was charged); the managed cloud VPS range then scales up to multi-core, multi-tens-of-GB-RAM builds. The Entry Cloud I tested is deliberately the modest end of the range — if it holds up here, the bigger builds have more headroom.
I tested the Sofia node, but the location is worth a closer look because ScalaHosting runs a broad network of 24 locations worldwide. That includes its own native data centers in Sofia (Bulgaria) and the US (Dallas, New York, Seattle), plus Integrated Cloud and AWS regions across Europe (Amsterdam, Helsinki, Madrid, Stockholm, Copenhagen, Stavanger, Warsaw, Dublin, Paris, London, Frankfurt), North America (Ohio, Virginia, Oregon, Montreal) and Asia-Pacific (Tokyo, Seoul, Mumbai, Singapore, Sydney). In practice that means you can put your VPS close to your audience — the full list is on the network & data centers page.
Source for plan/pricing facts: the managed cloud hosting page and my own client area, as of the test date.
SPanel: the in-house control panel
The headline reason to pick ScalaHosting over a generic VPS is SPanel, its proprietary control panel. ScalaHosting built it as a cPanel alternative, and the practical selling point is real: no per-account licensing fee, so you can create unlimited accounts without cPanel's per-account cost creeping in. Details on the SPanel page.
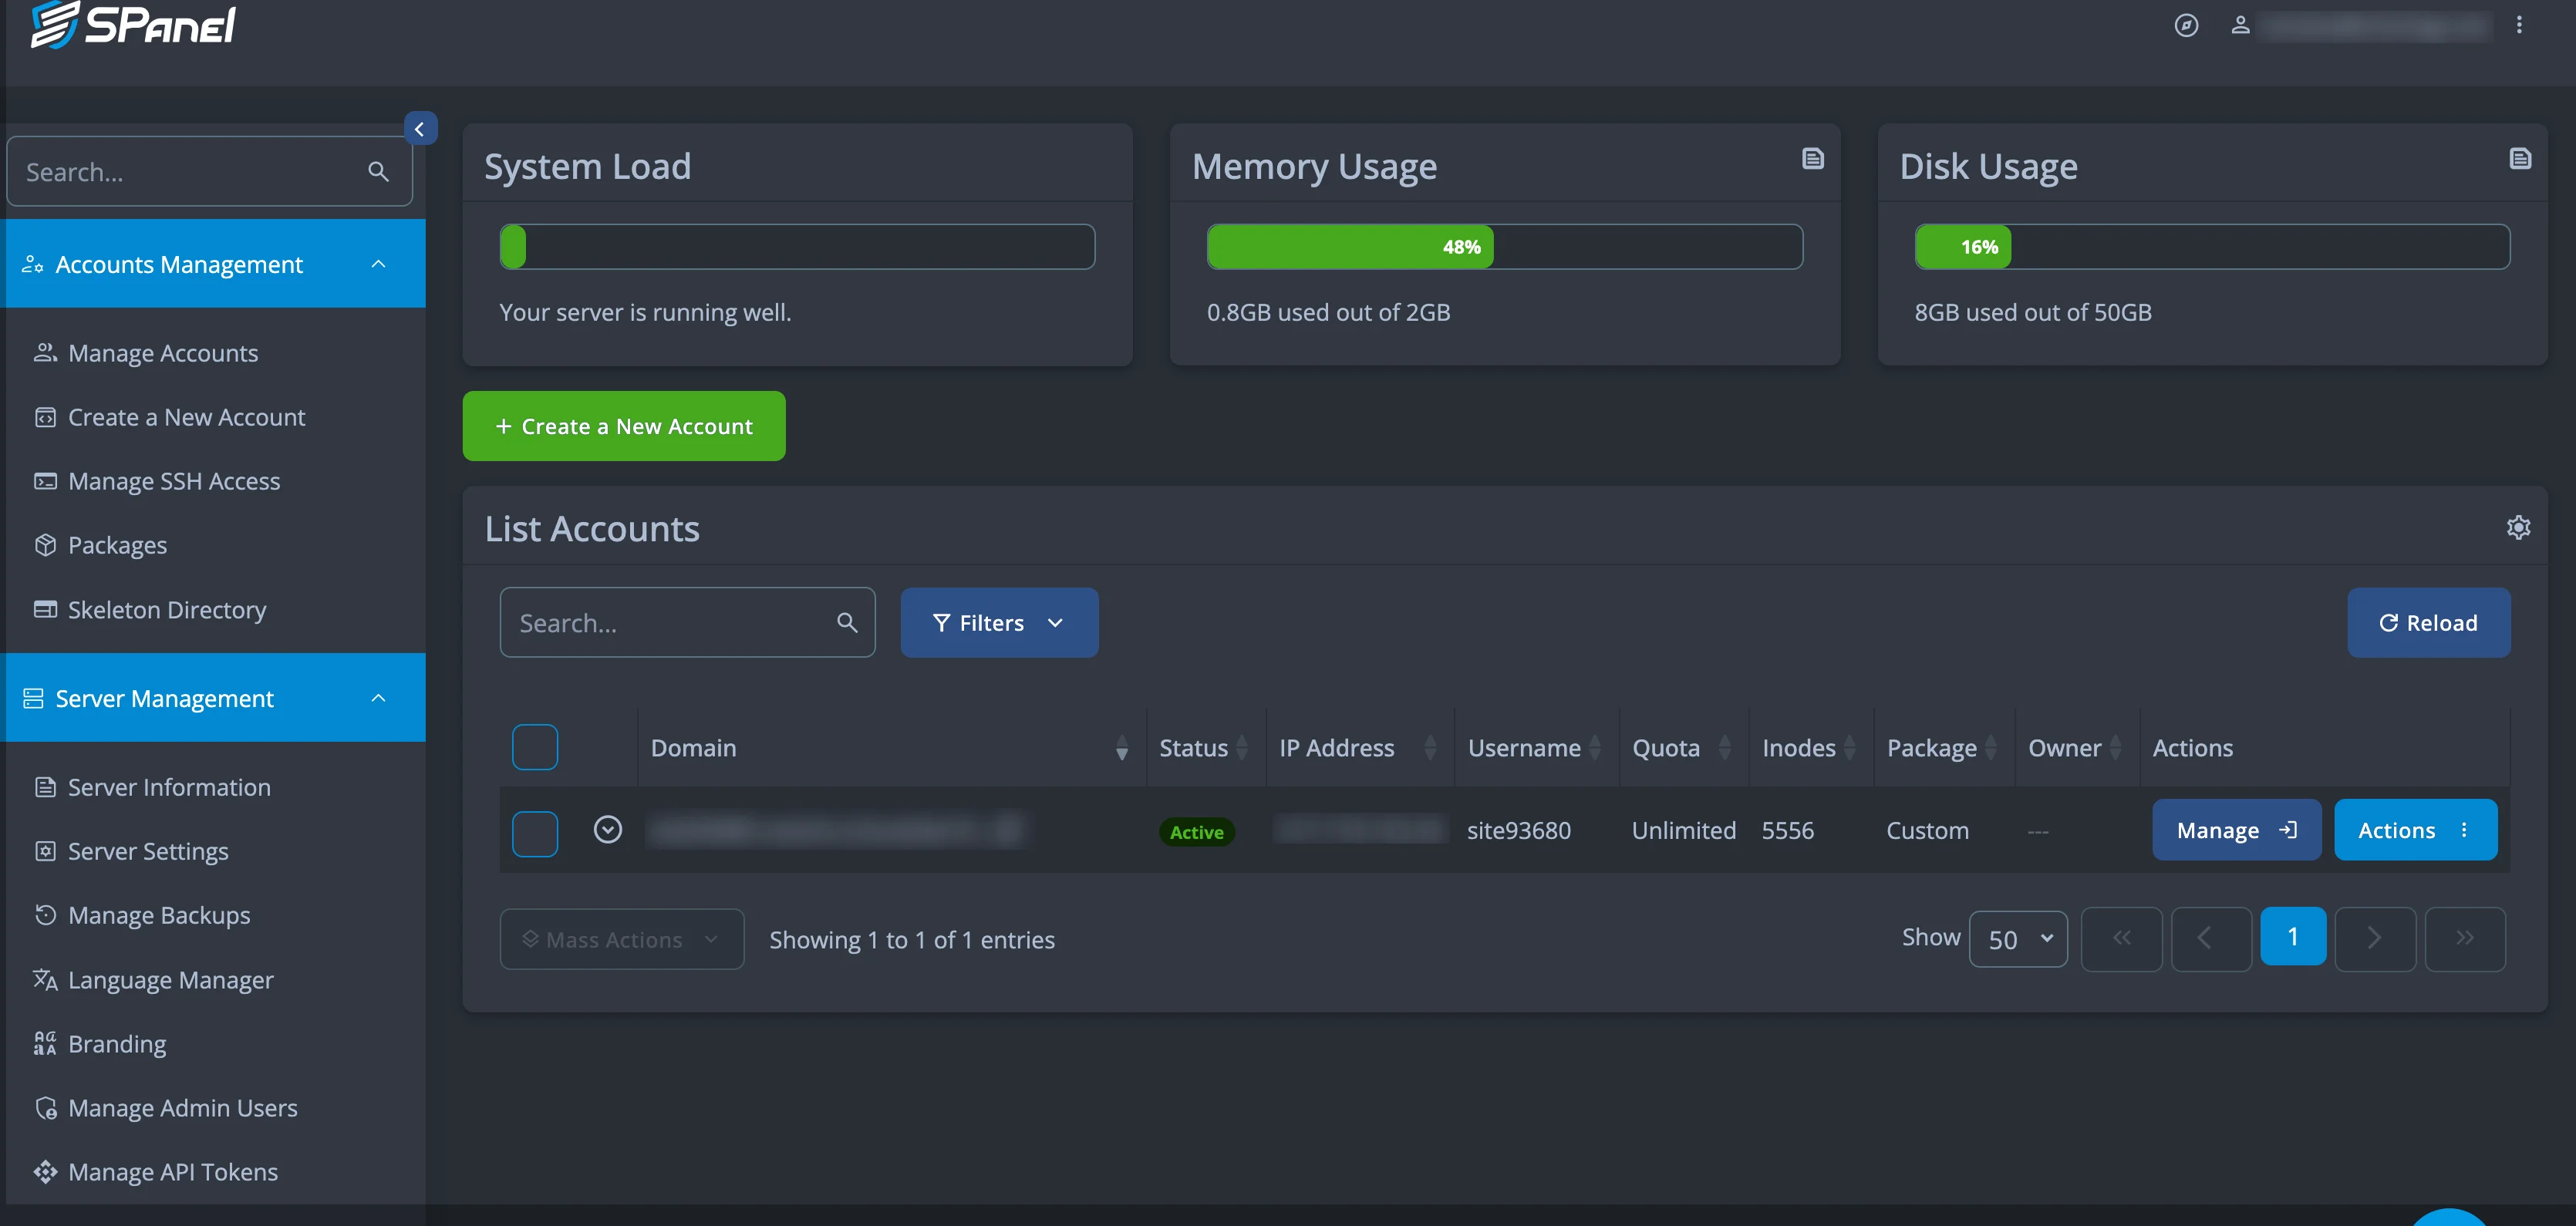
It splits into two interfaces. The admin dashboard is for managing the server: at-a-glance system load, memory and disk gauges, plus account management, packages, backups, branding, SSH access and API tokens.
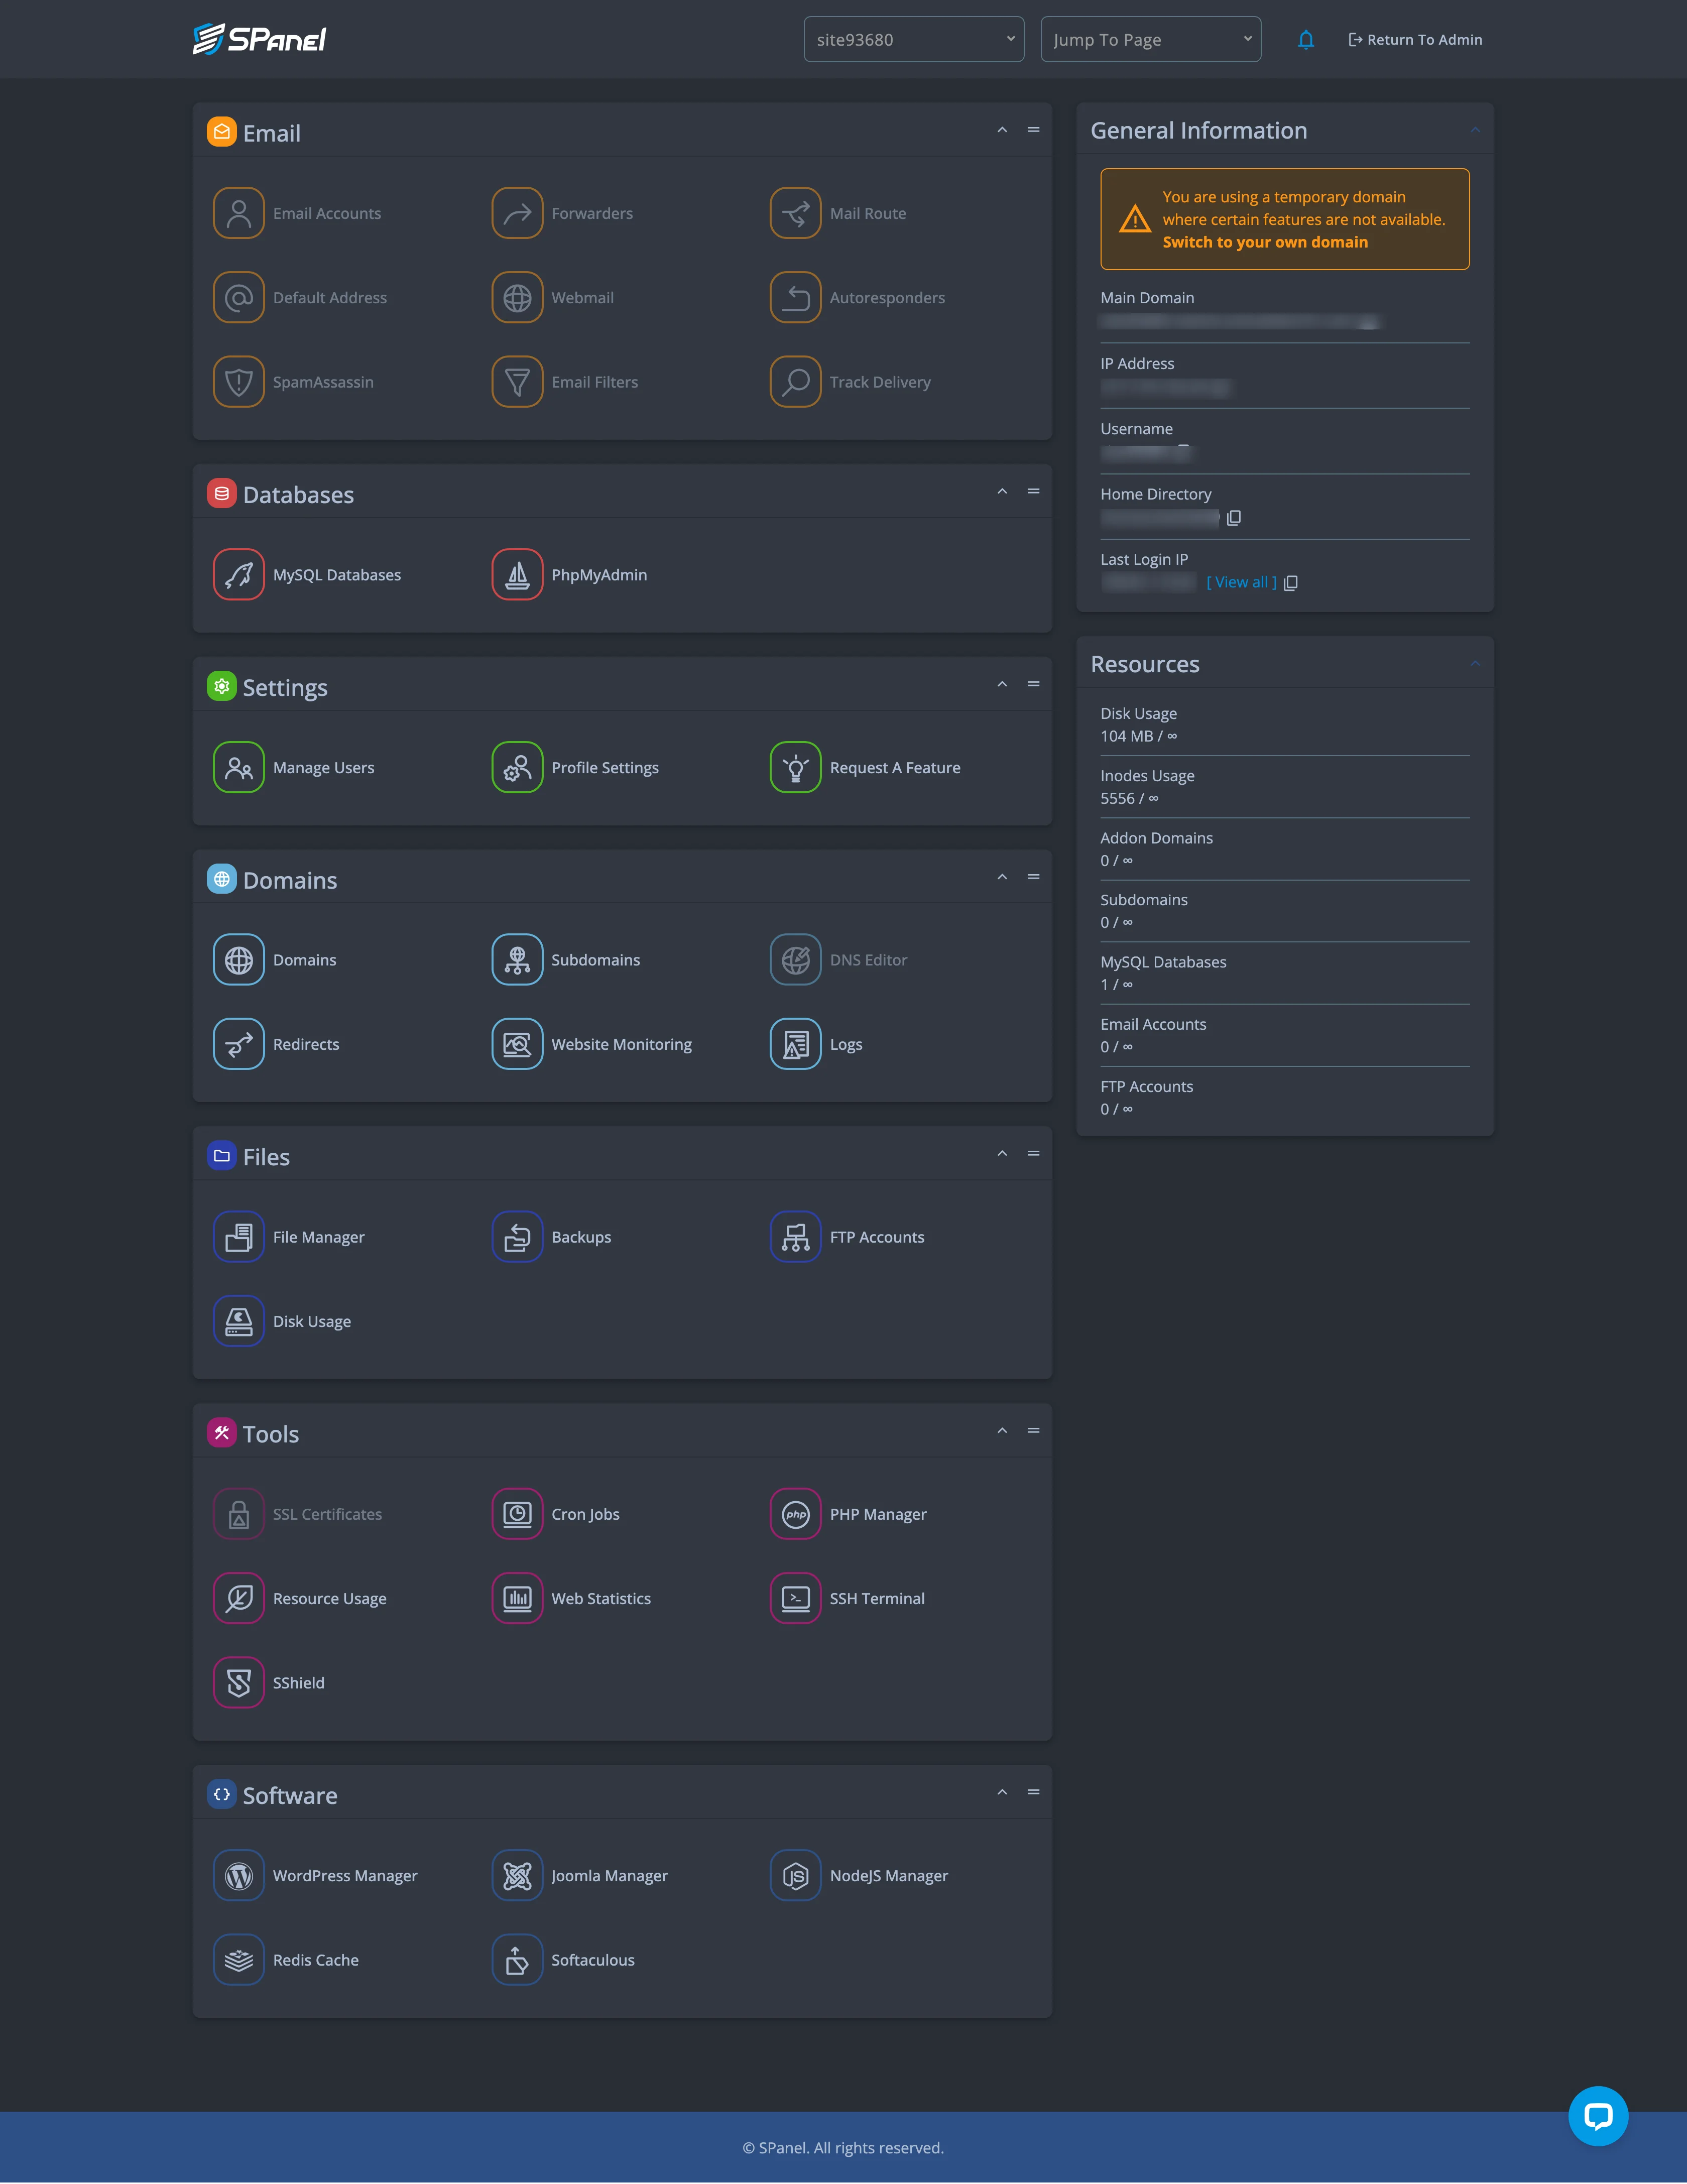
The user dashboard is what a site owner works in day to day — email, databases, domains and DNS, a file manager, SSL, cron, a PHP version manager, web statistics, an SSH terminal, and a Software section with a WordPress Manager, Softaculous (400+ apps), a Node.js manager and Redis cache.
Spinning up a site is genuinely one screen: when you create a new account you choose between a ready-to-use WordPress install, WordPress with the Spectra builder, or an empty account, on a temporary domain or your own.
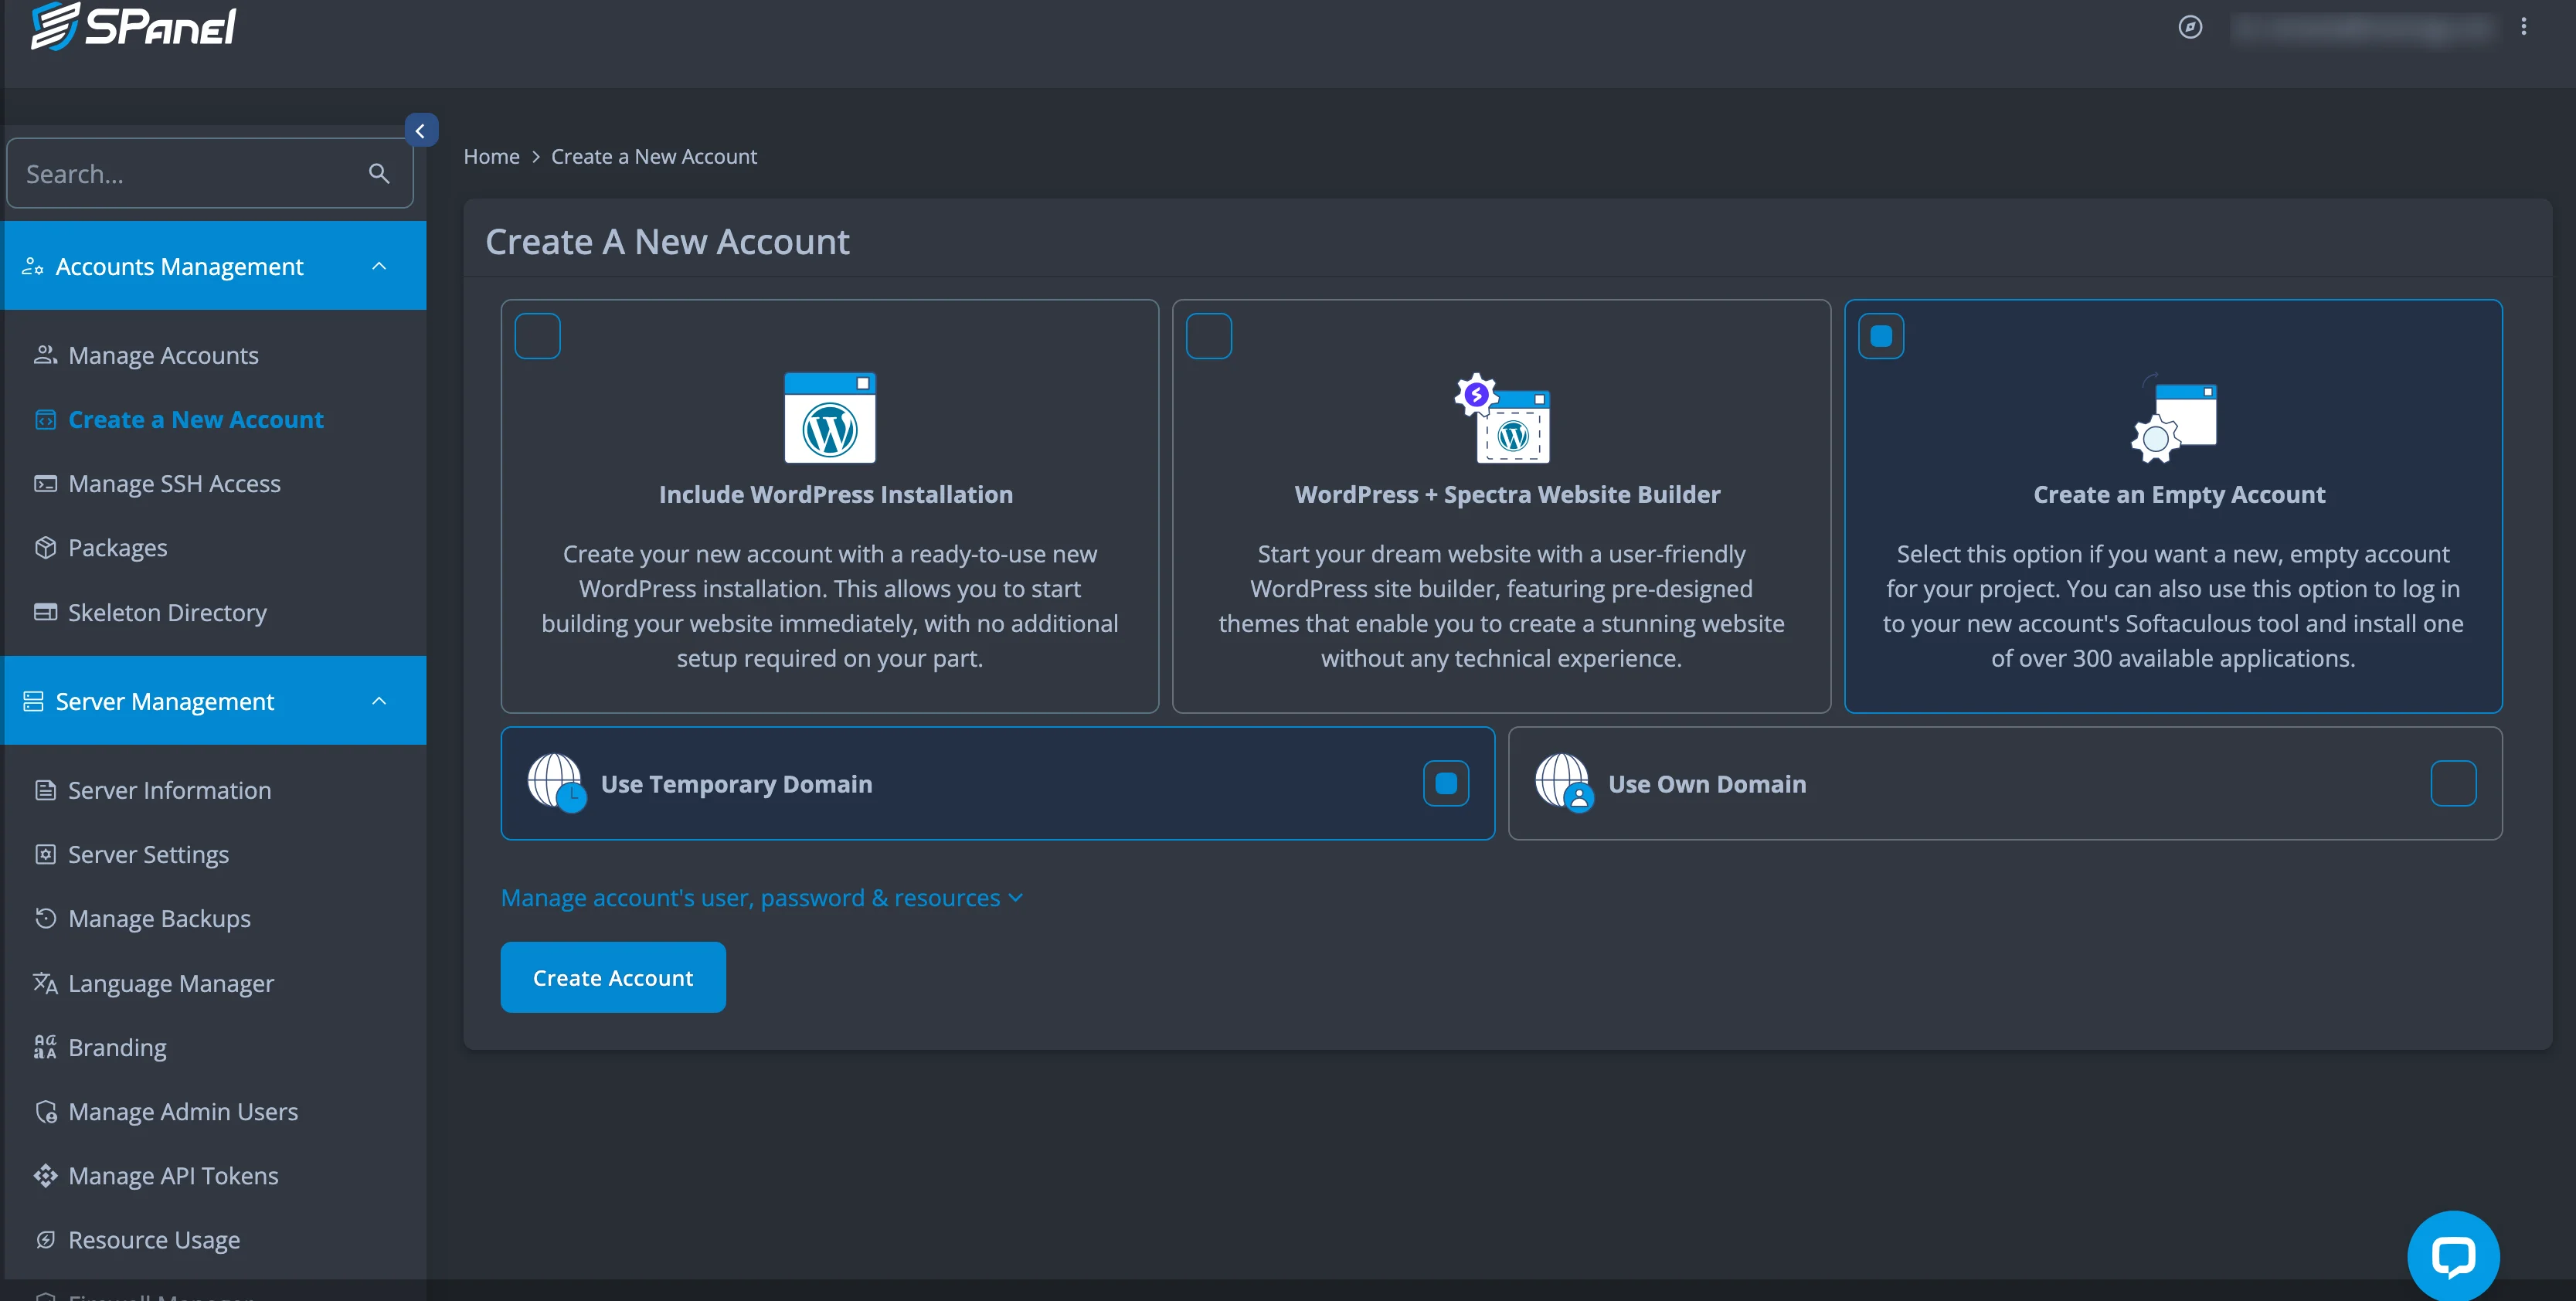
This is the kind of control panel I'd be comfortable handing to a non-technical client. It doesn't try to look like cPanel; it's cleaner, and the WordPress-first onboarding removes the usual “now go install WordPress” step. ScalaHosting also runs a public feature-voting board, so the panel's roadmap is at least partly user-driven.
SShield: security that's actually on by default
Every plan ships with SShield, ScalaHosting's AI/ML security layer. It runs at the server level, watching requests, file-system changes and database queries in real time, and blocks threats automatically with no configuration. ScalaHosting claims a 99.998% attack block rate and under 5 ms per-request overhead, with the threat database refreshed hourly from a network of 100,000+ servers. Full description on the website security page.
I can't independently verify a 99.998% figure in a hosting review, so treat that as a vendor claim — but the part that matters in practice is that it's included, server-level, and on by default, rather than a paid add-on or a plugin you have to remember to configure. For a managed product that's the right call.
Onboarding and first contact
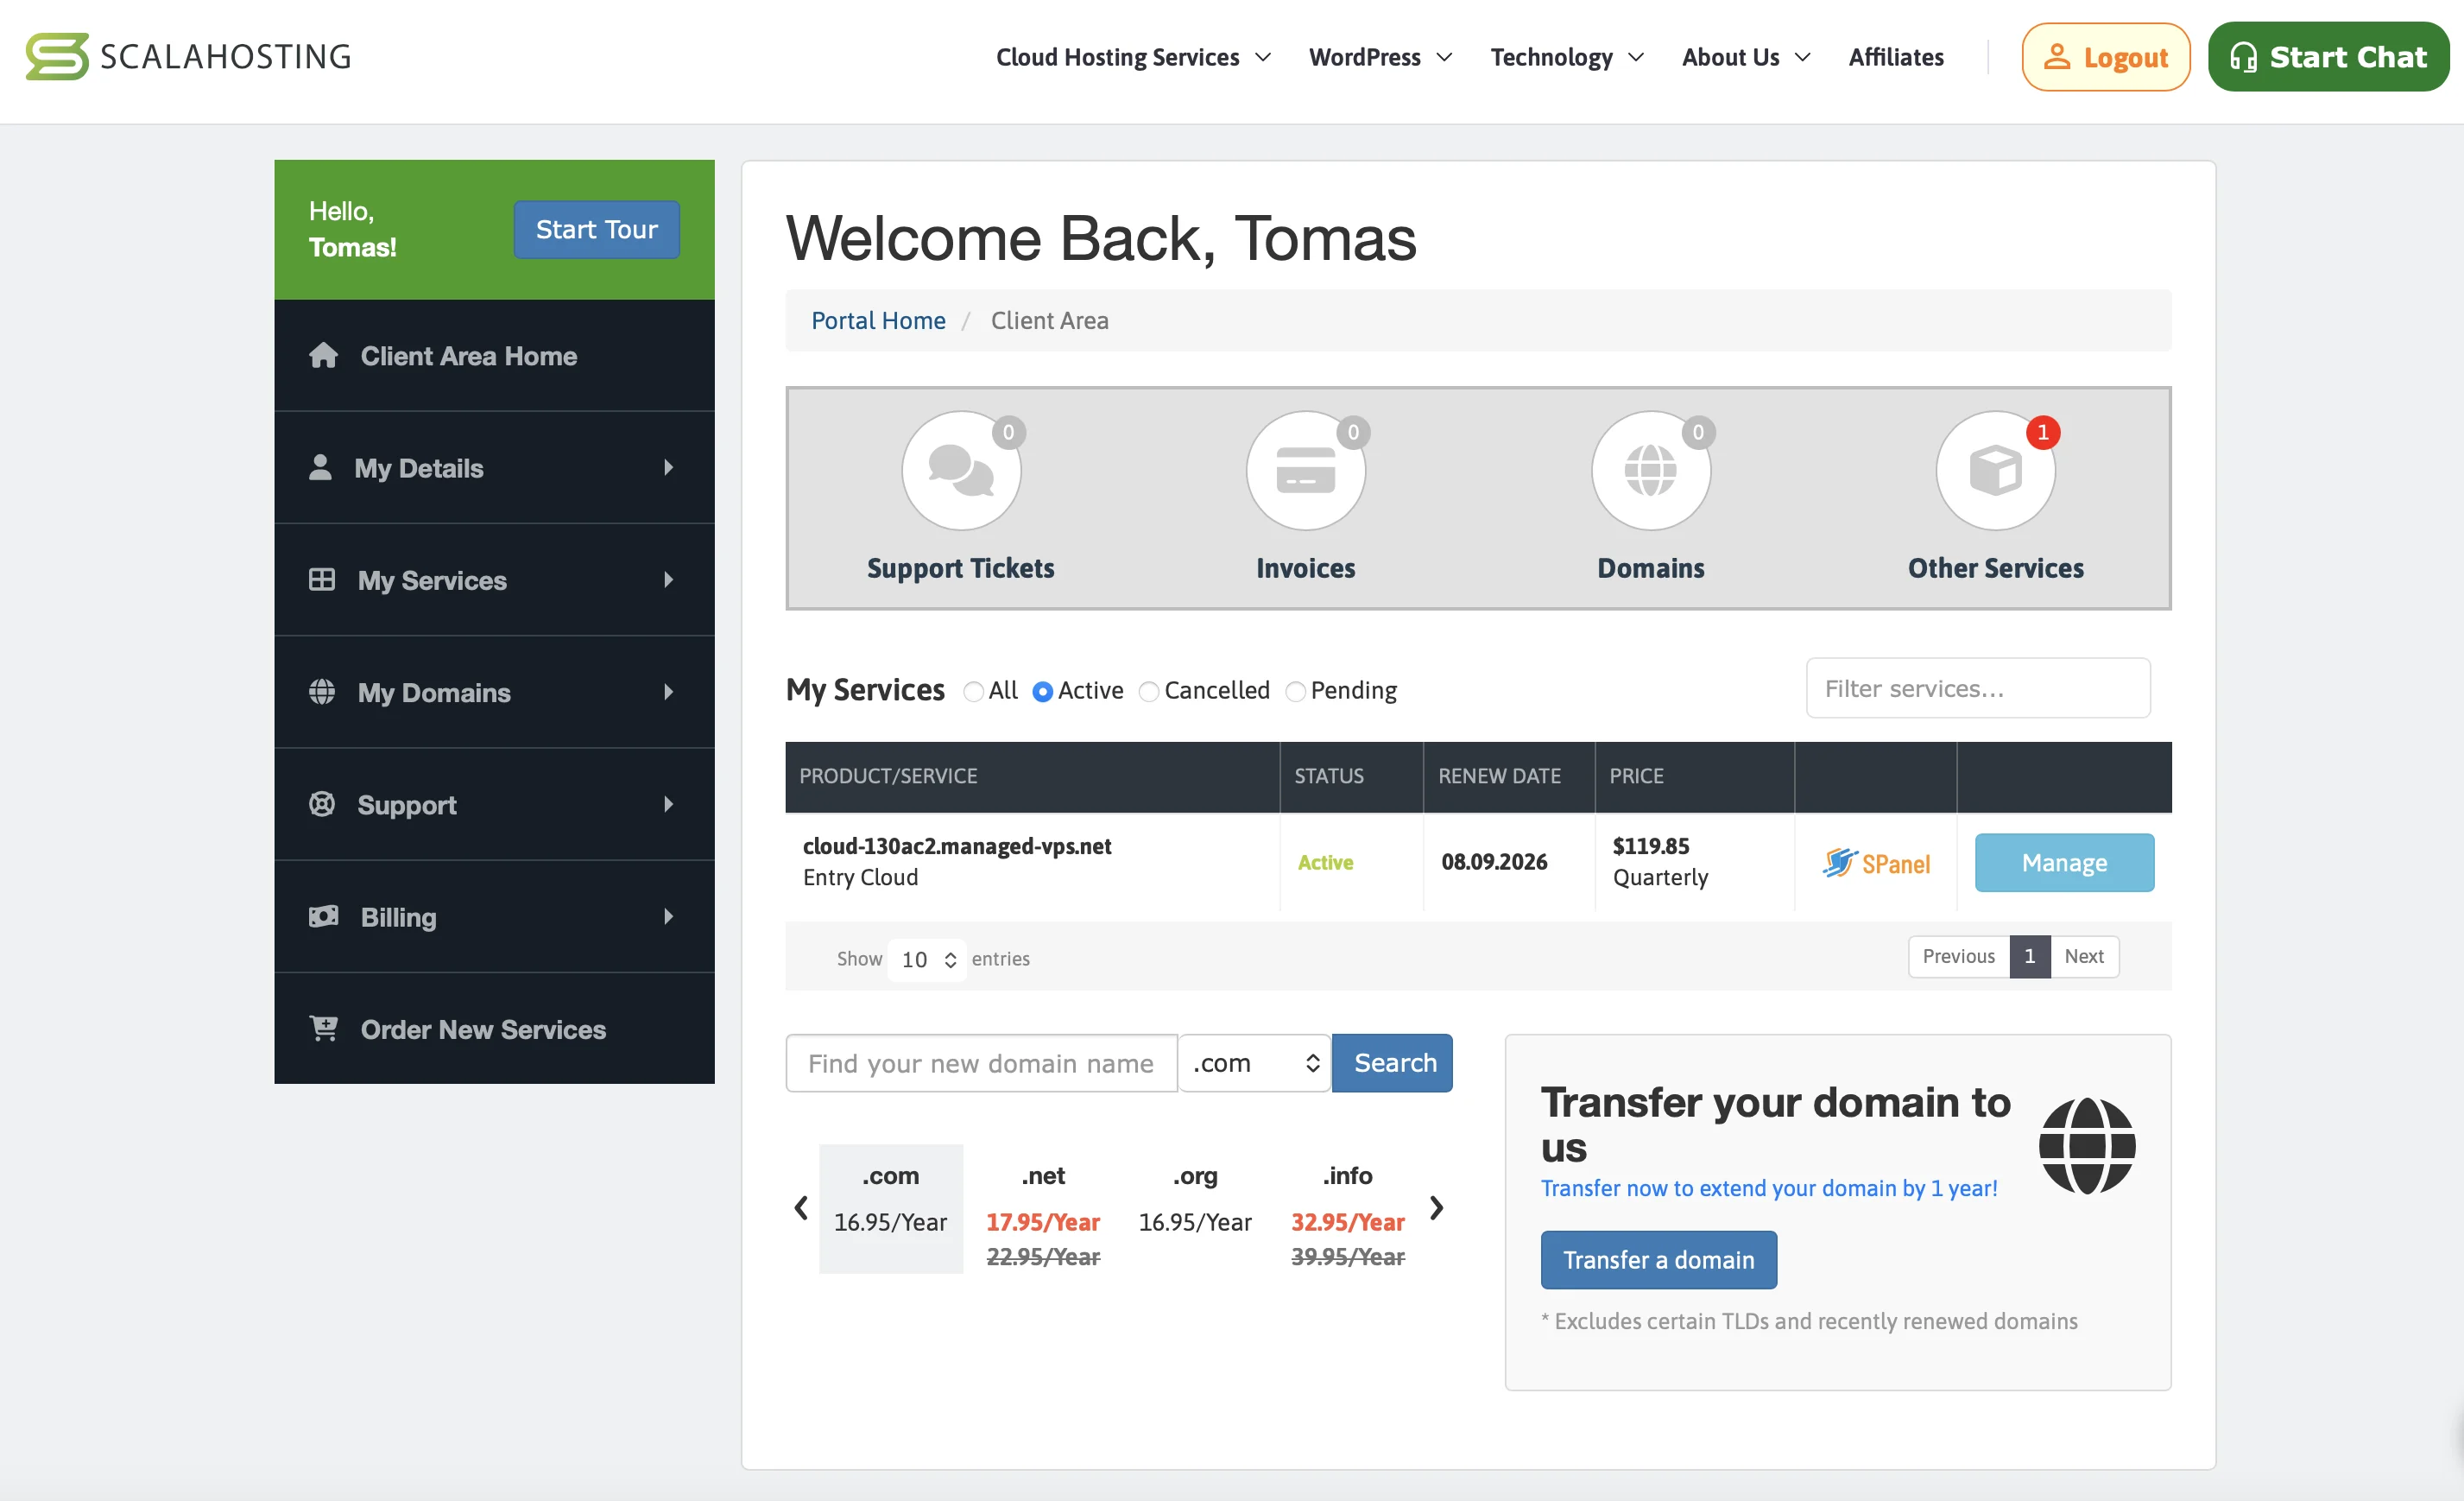
Onboarding runs through a standard client area (the WHMCS-style portal), where you see your service, invoices and domains, and jump into SPanel.
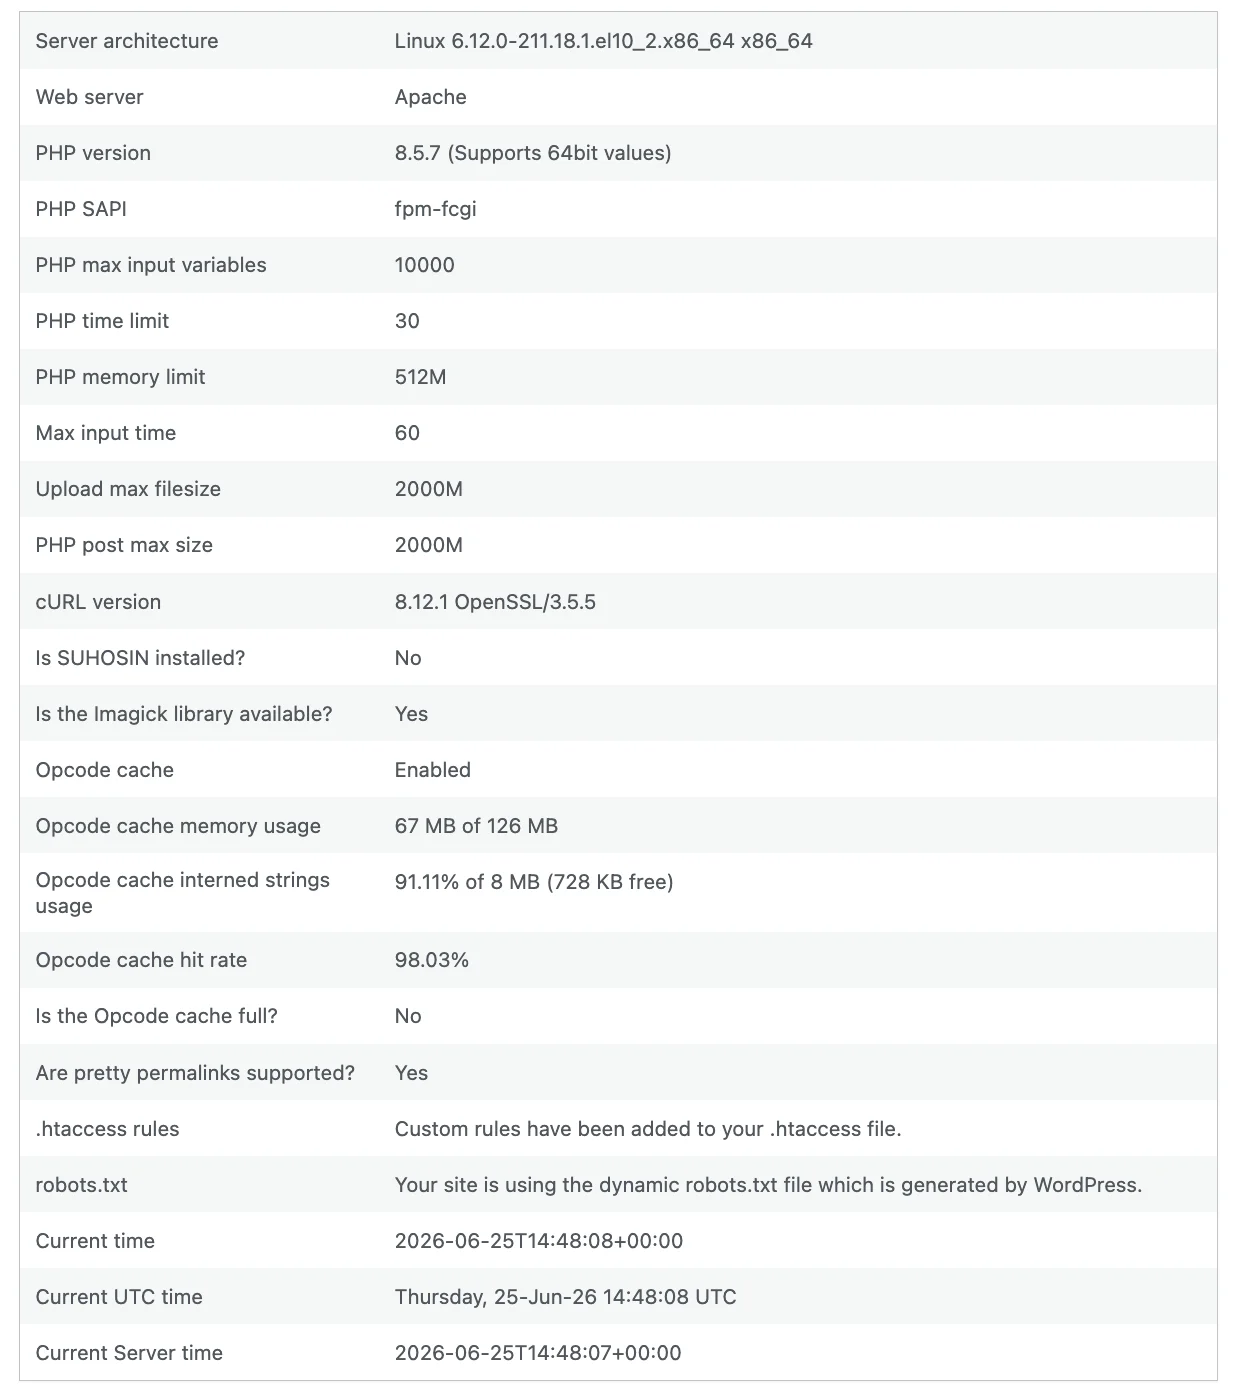
From order to a working WordPress install was quick and didn't require touching the command line — the managed angle holds up. For reference, the server I was provisioned with reported a current stack: Apache, PHP 8.5.7 (FPM), memory_limit 512 MB, max_execution_time 30 s, OPcache enabled with a 98.03% hit rate, on AlmaLinux 10.
Support is the other half of a managed product, and it’s where ScalaHosting stakes much of its reputation. I didn’t need to lean on it heavily during testing, but for the record the vendor cites a roughly 15-second average response time, a 98.9% satisfaction rate and a #1-ranked support team — numbers I can’t independently verify here, but consistent with the overwhelmingly positive support feedback ScalaHosting carries across review platforms. For most managed-VPS buyers, who lean on the support desk rather than a terminal, that track record weighs as heavily as the benchmarks.
Testing methodology
To keep results comparable across reviews, I use the same method on every host: three WordPress sites on the same hosting.
- Clean WordPress — fresh install, default theme, no content
- WordPress Blog — a handful of articles and pages, a typical theme
- WooCommerce e-shop — 1,000 products and several pages
On each I ran the same toolset:
| Tool | What it measures |
|---|---|
| WP Benchmark | CPU, filesystem, database, WP core and network → a 0–10 “server score” |
| PageSpeed Insights | Performance, LCP, TBT, CLS for mobile and desktop |
| SpeedTest Pro | PHP and MySQL operations (seconds) + network throughput, vs an “industry average” |
| Query Monitor | real page-generation time, memory, DB query count and time |
| k6.io | spike, ramp up/down and sustained load — RPS, P95 response, failure rate |
Measured on the Entry Cloud plan (2 vCPU / 2 GB / 50 GB NVMe SSD, Sofia). The point of the load tests in particular is to see whether a 2-core box drops requests under pressure — and whether any rate-limiting kicks in, which has skewed this test on other hosts.
Results: WP Benchmark
WP Benchmark stresses each server component and returns a 0–10 score. ScalaHosting landed in solid territory and stayed consistent as the sites got heavier:
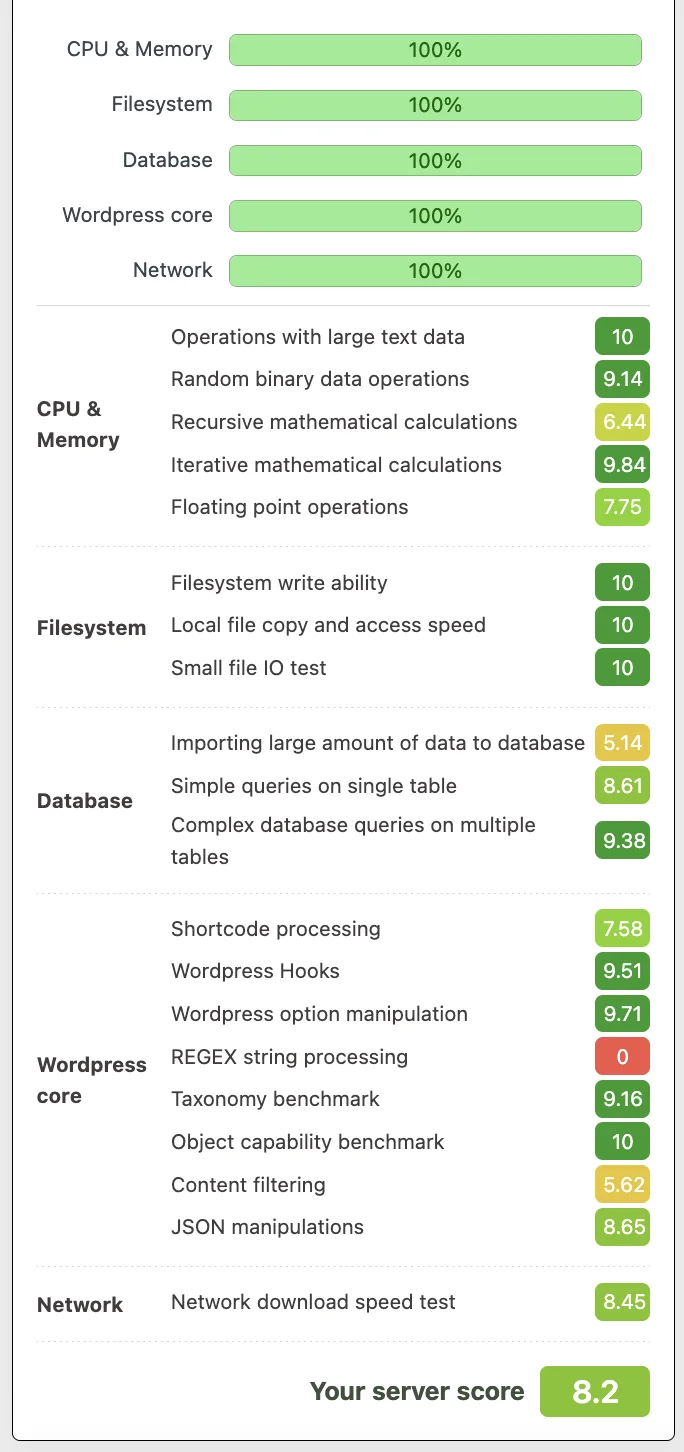
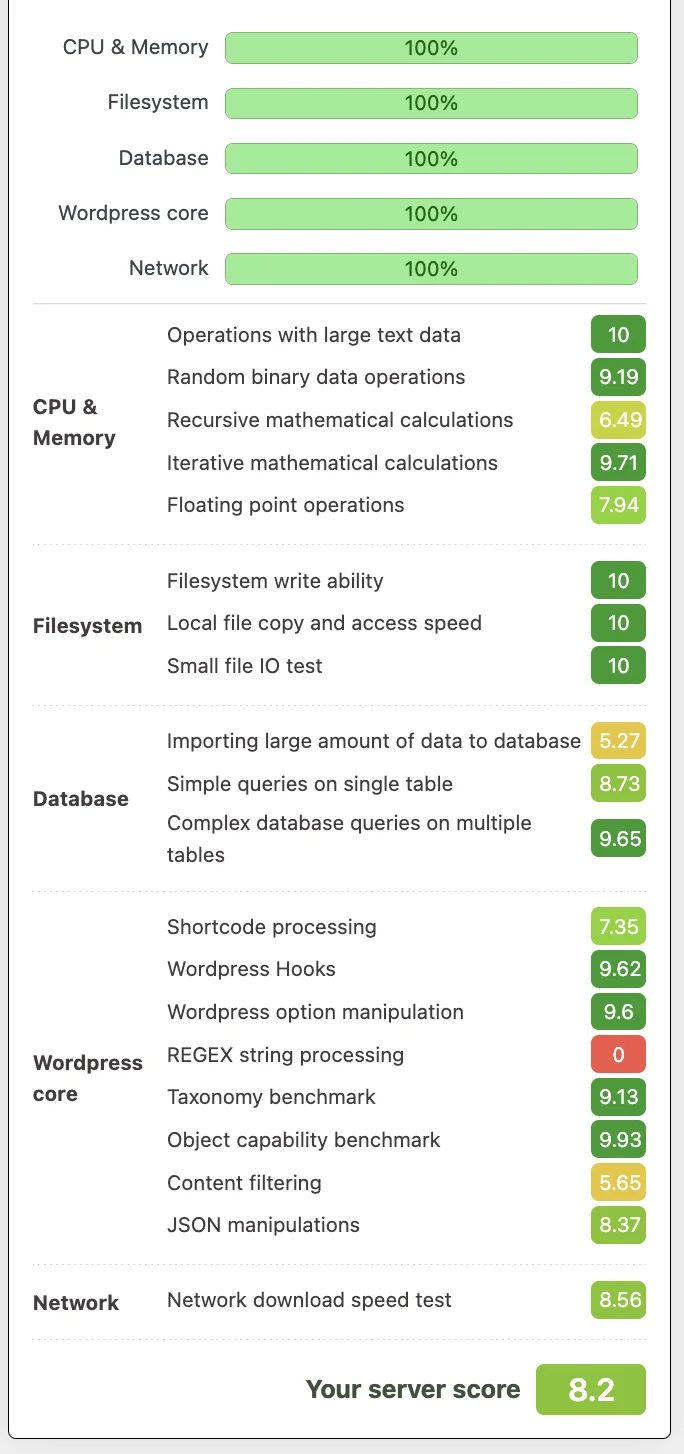
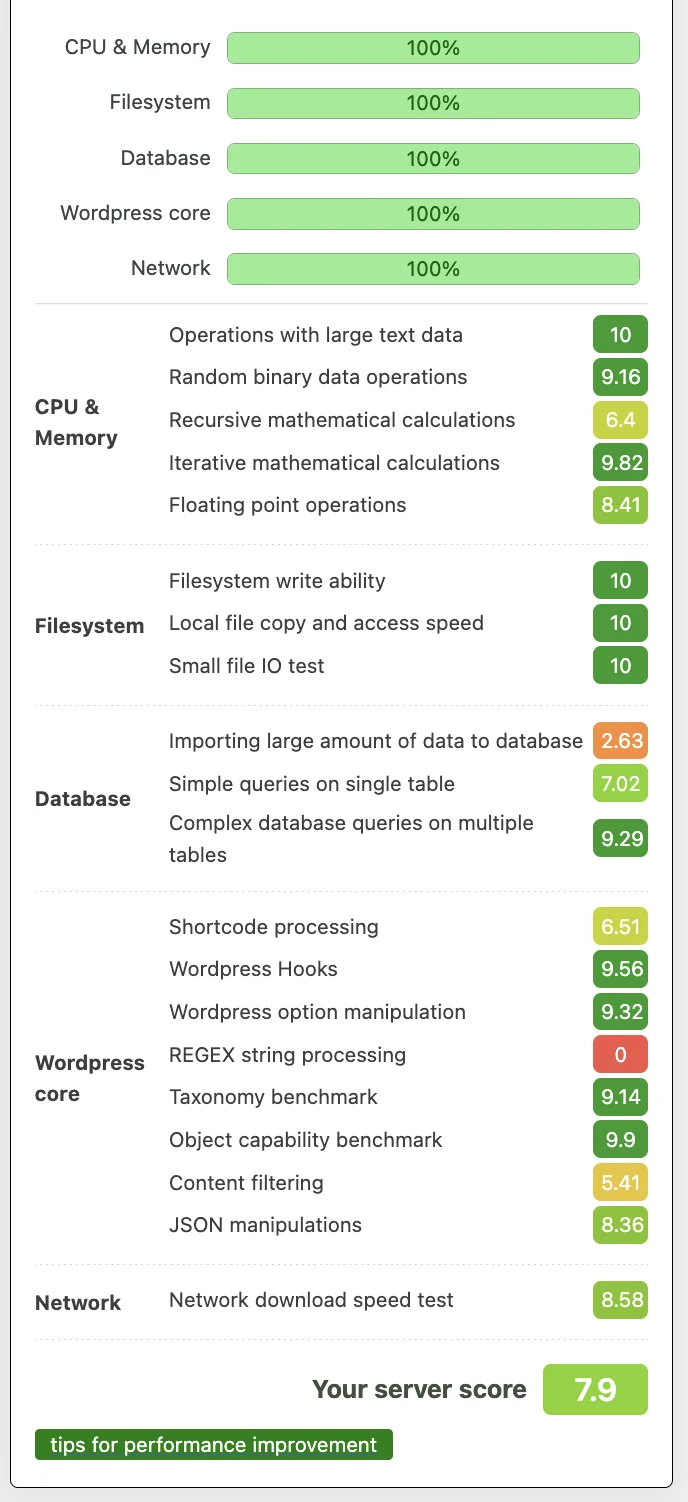
8.2 / 8.2 / 7.9 is a good, stable result — the score barely dips even on the 1,000-product shop. The one component that pulled the WooCommerce score down was “importing a large amount of data to the database,” which is common for this benchmark on a heavy shop and didn't translate into slow real-world pages (see Query Monitor below).
Results: PageSpeed Insights
I ran PageSpeed for both mobile and desktop on all three sites:
| Site | Desktop perf. | Desktop LCP | Mobile perf. | Mobile LCP |
|---|---|---|---|---|
| Clean WordPress | 100 | 0.4 s | 98 | 2.0 s |
| WordPress Blog | 90 | 1.2 s | 75 | 5.6 s |
| WooCommerce e-shop | 90 | 1.2 s | 69 | 5.0 s |
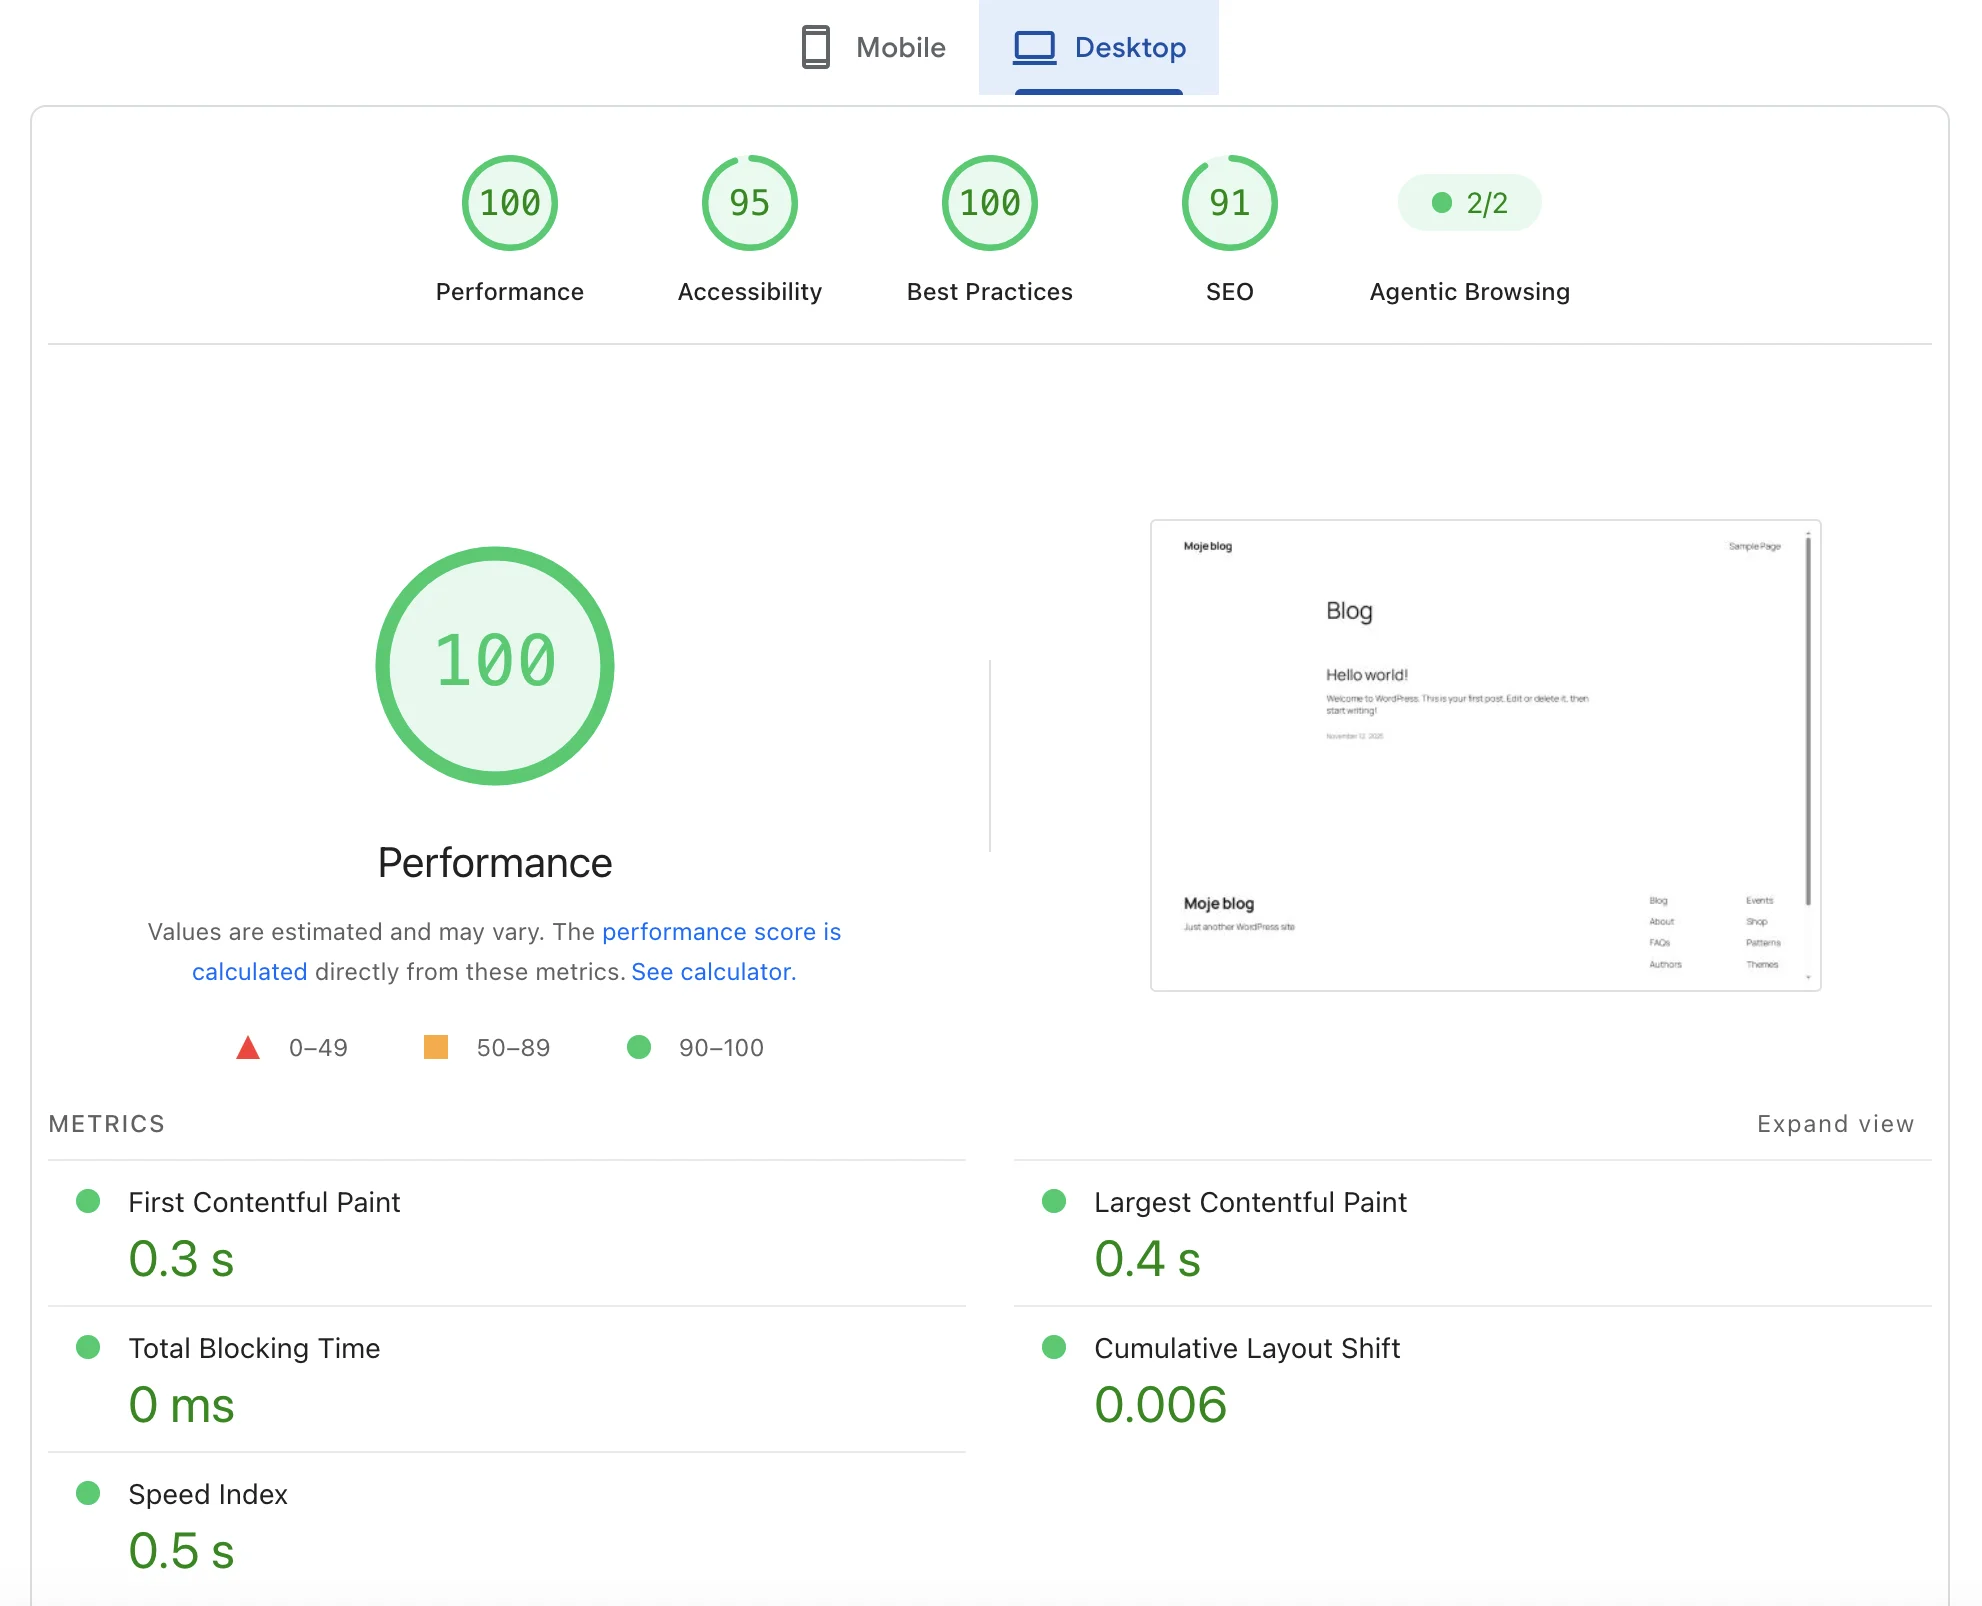
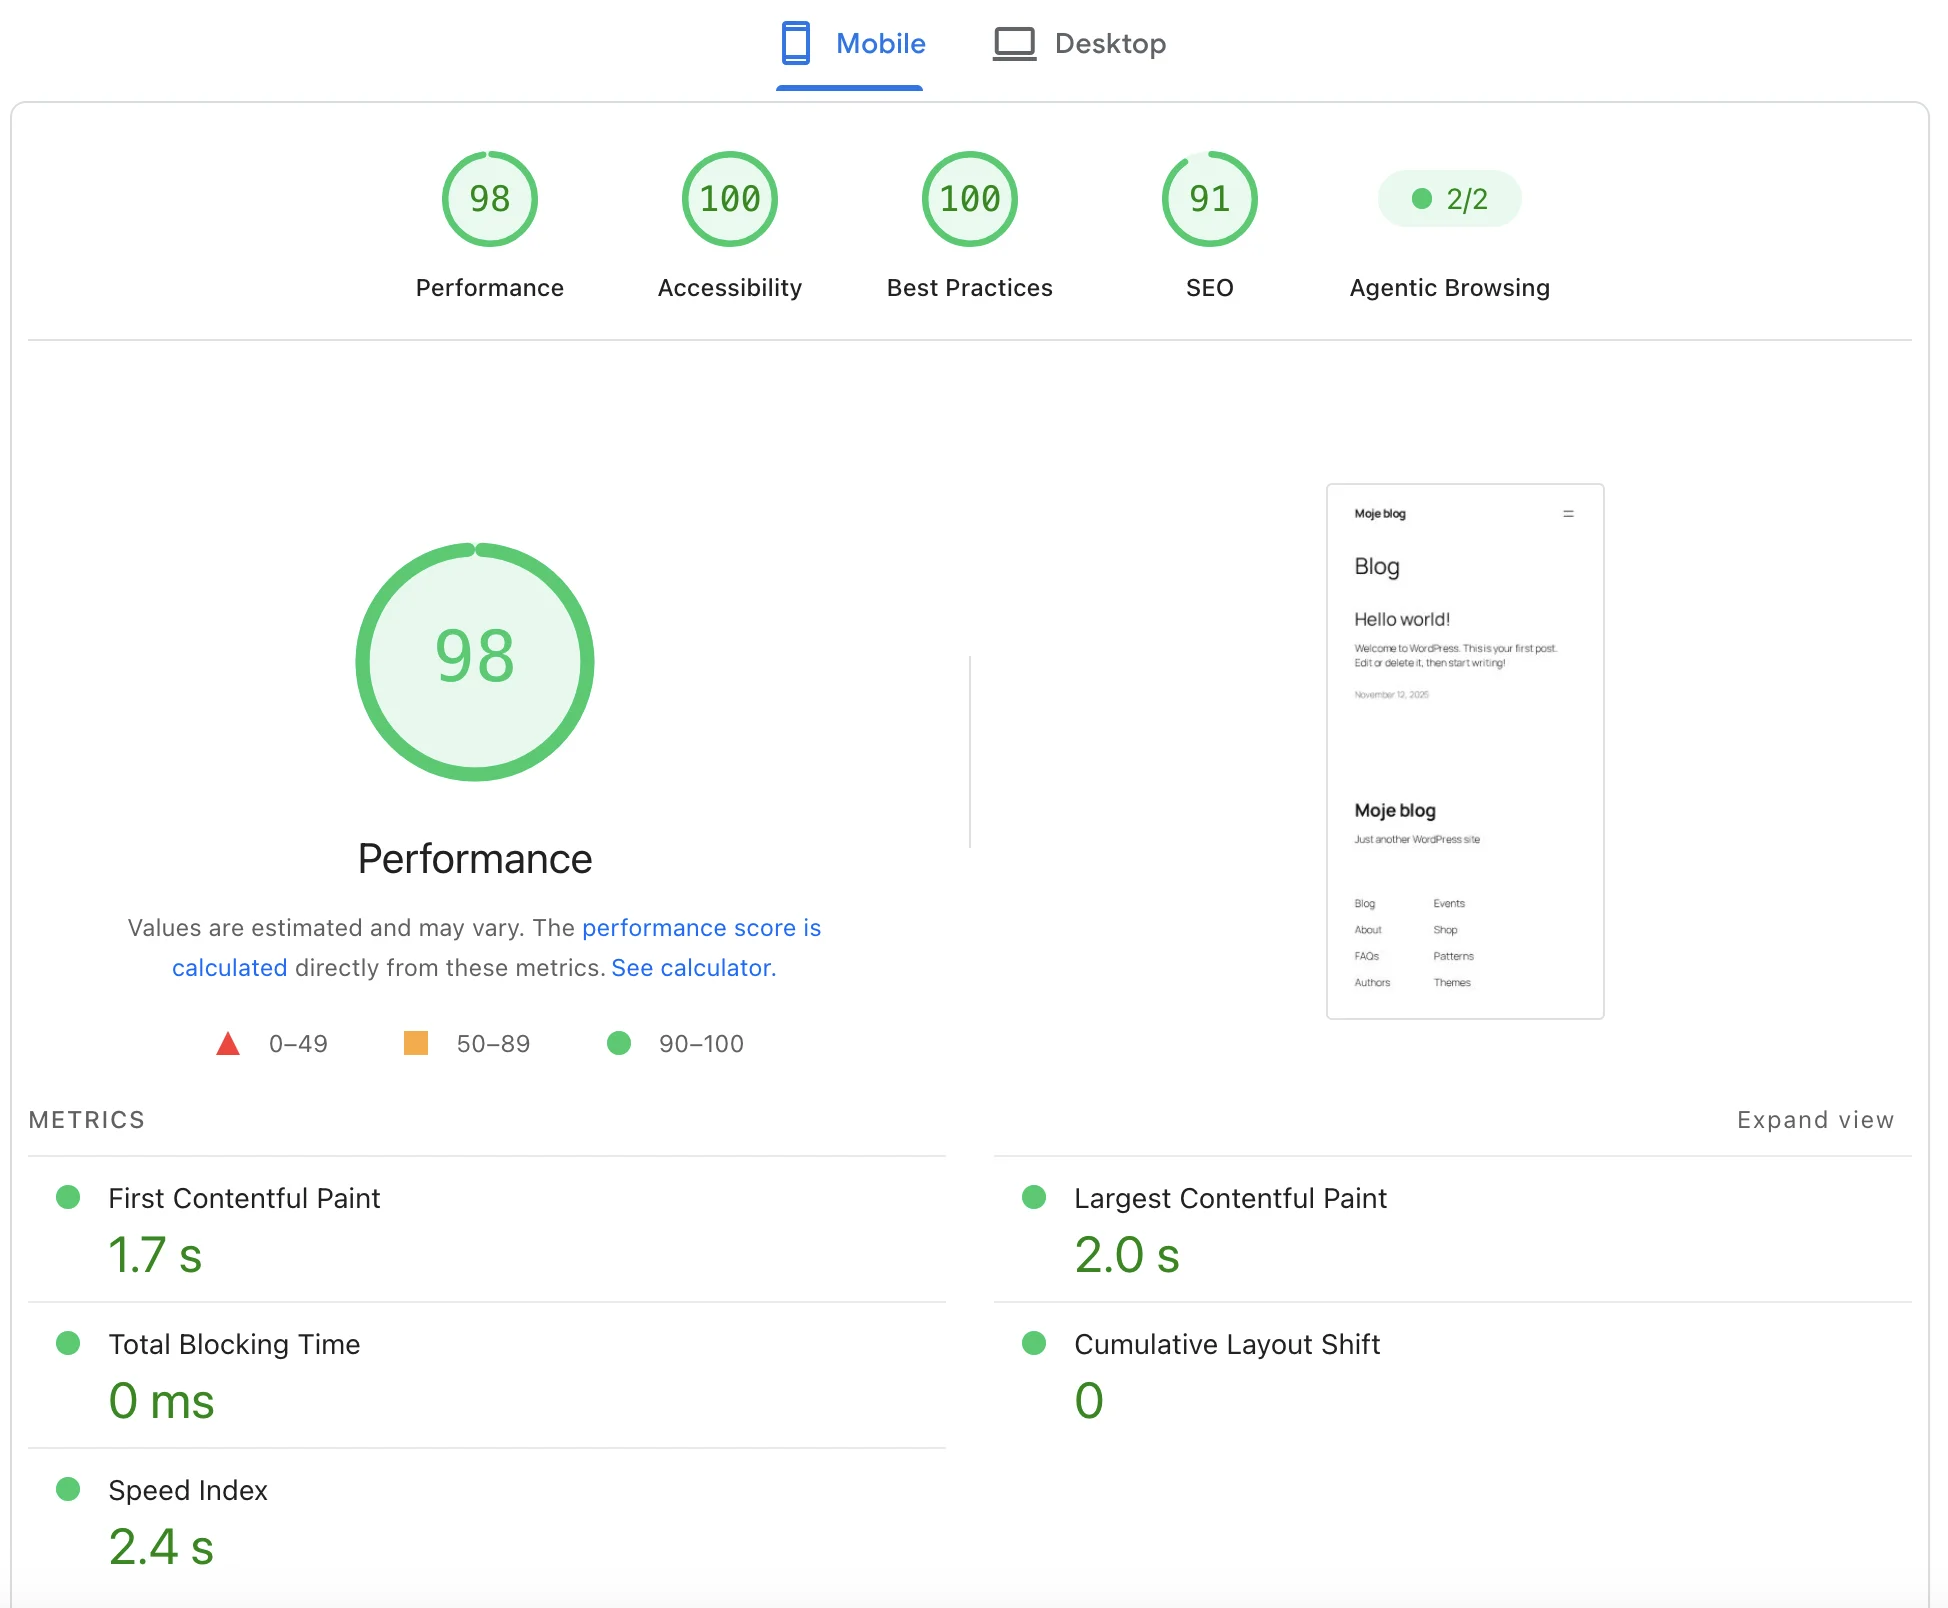
Desktop is excellent: a perfect 100 on the clean install and a steady 90 on both the blog and the shop, all with LCP at or near 1 second. The detail I always check — Total Blocking Time was 0 ms across the board, which tells me the backend delivers the HTML quickly and the browser isn't stalling on the server.
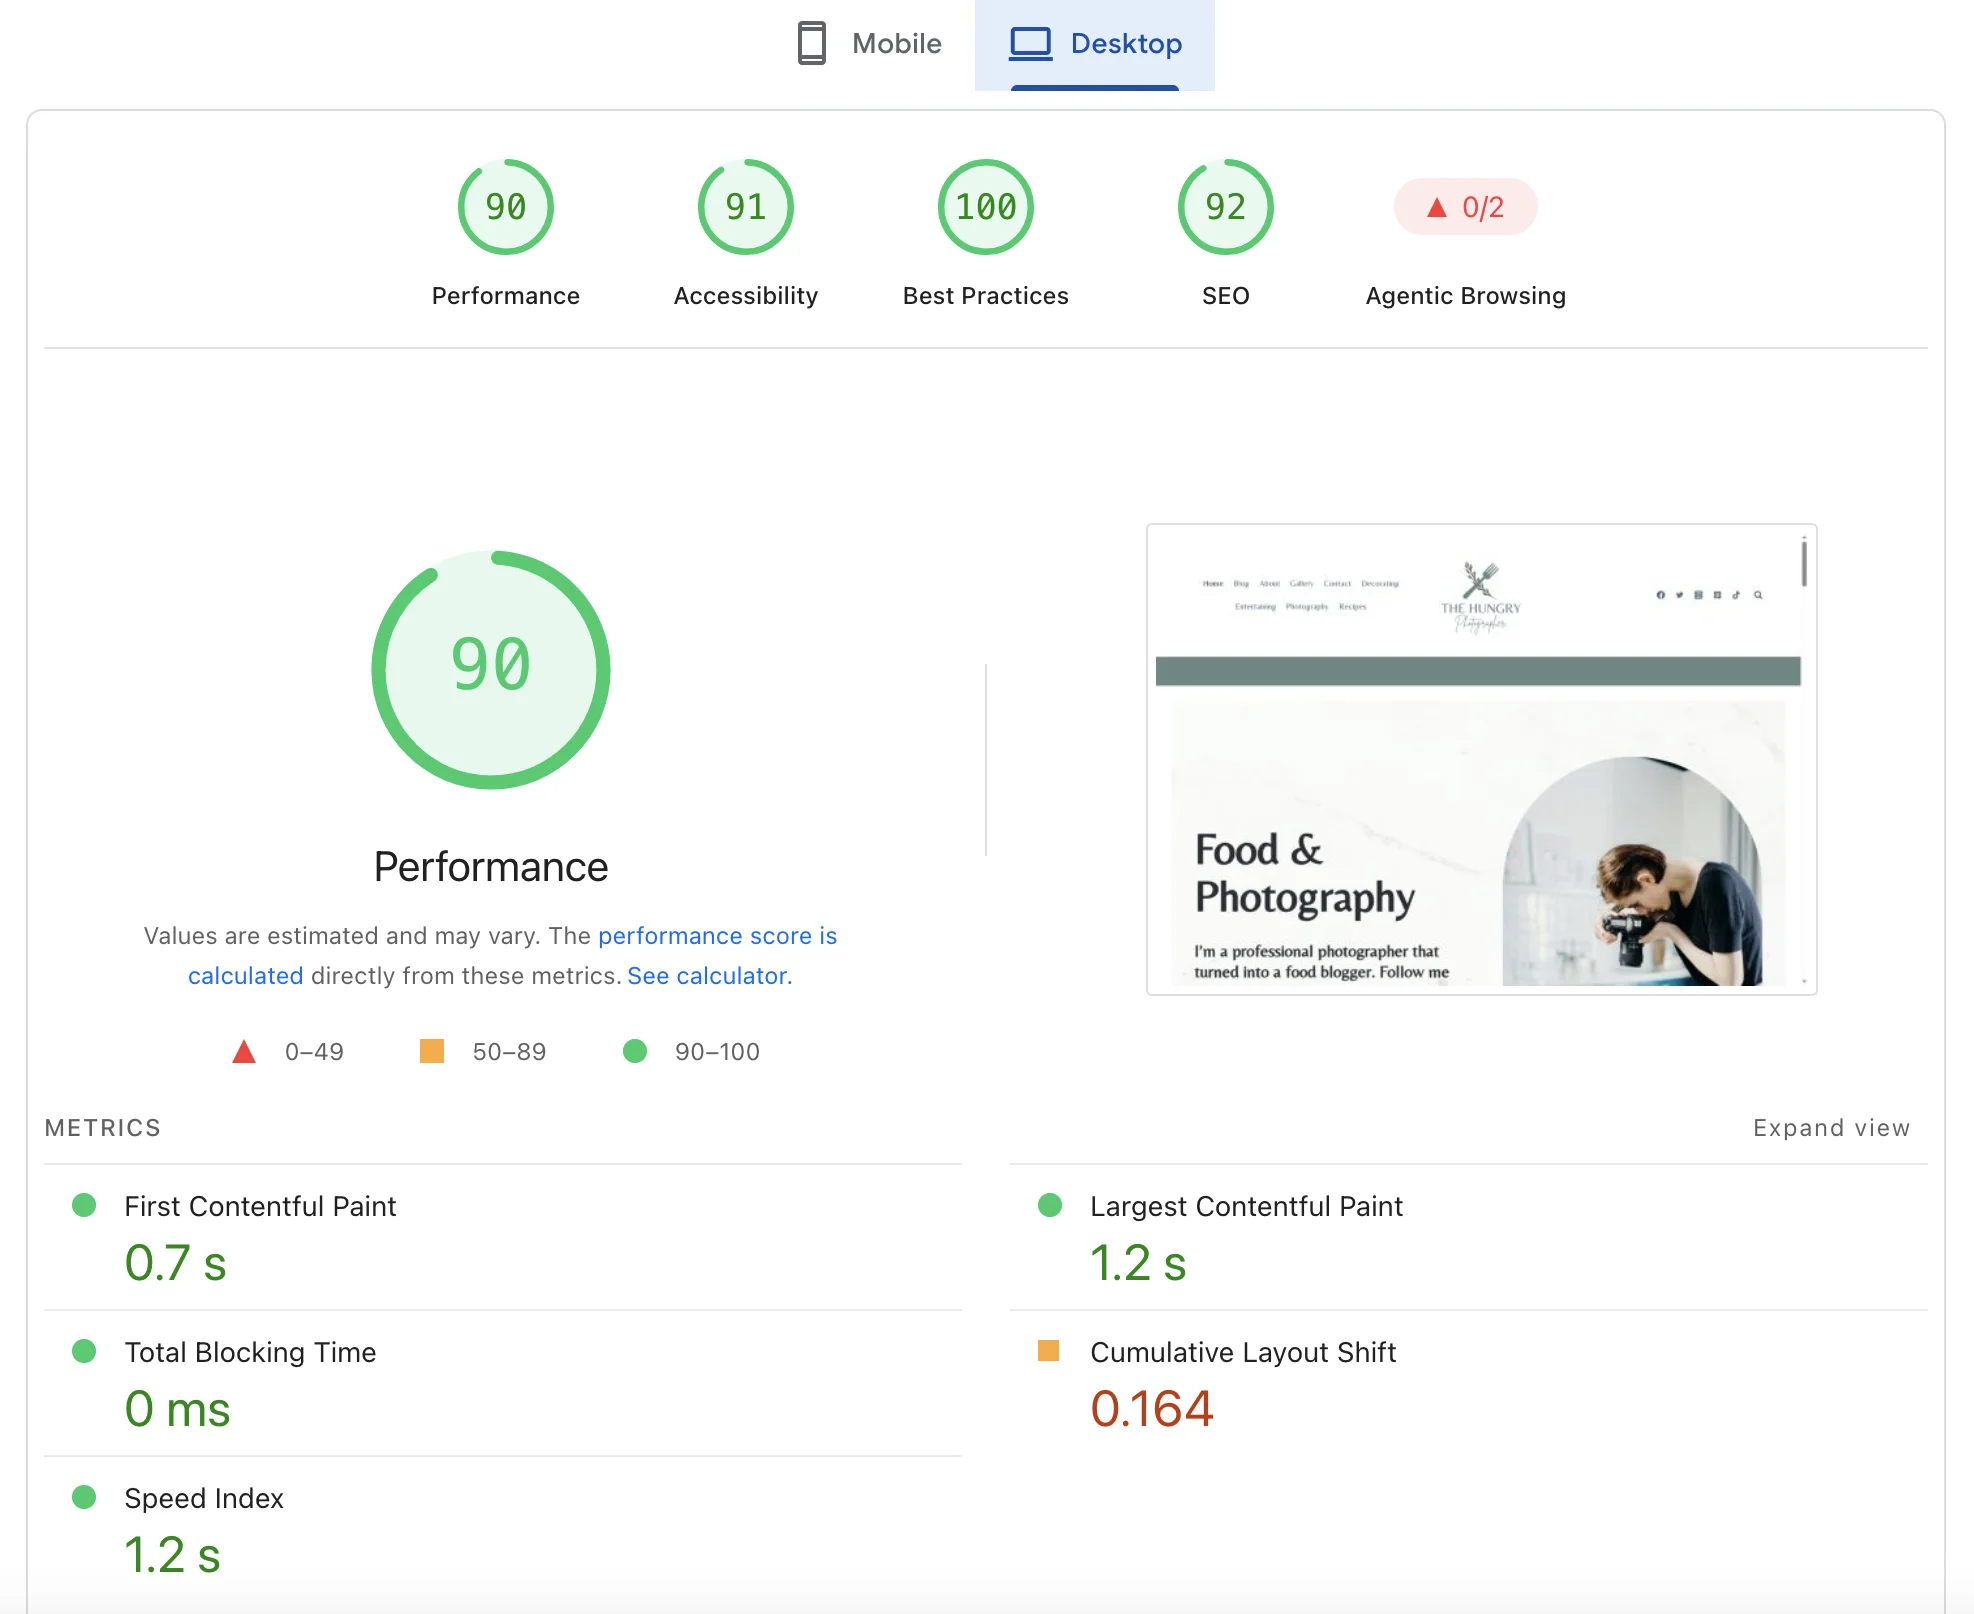
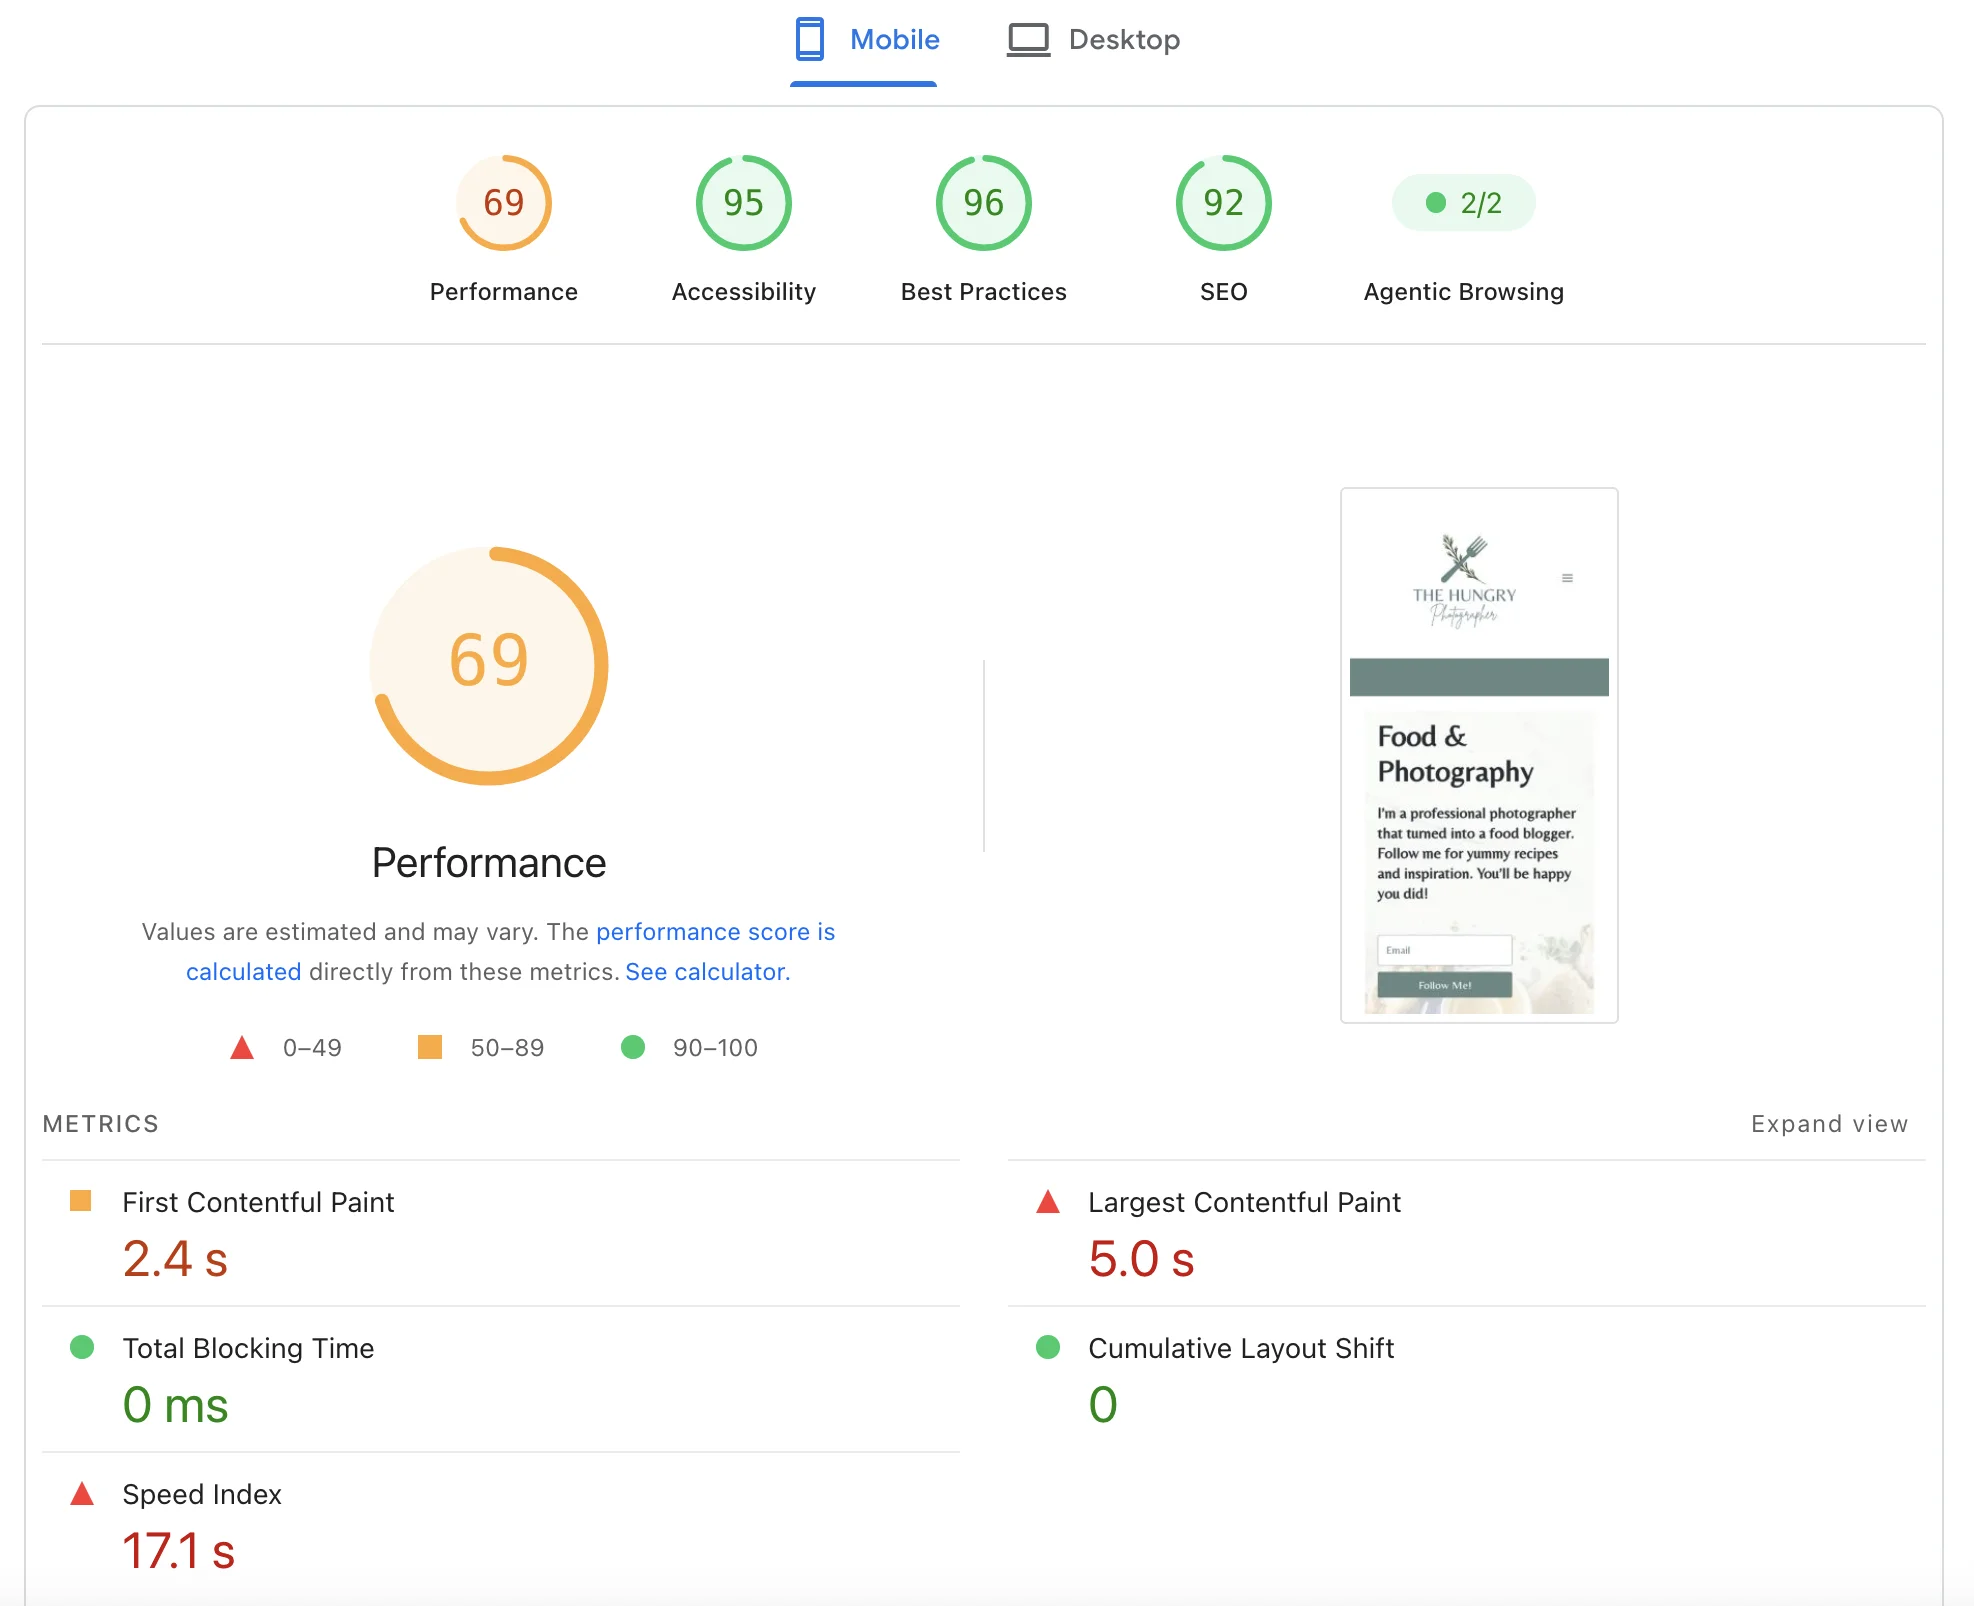
Mobile scores drop on the blog (75) and shop (69), but they need reading in context. The culprit is the large hero imagery in the demo themes plus the heavy throttling PageSpeed simulates on mobile — not the server (again, TBT 0 ms). The WooCommerce mobile Speed Index of 17.1 s is an outlier driven by the unoptimised demo shop on a throttled connection; with optimised images and caching it comes down hard. The desktop CLS of 0.164 on the blog and shop is a theme layout-shift issue, independent of the host.
Results: SpeedTest Pro
SpeedTest Pro times individual PHP and MySQL operations (lower is better) against an “industry average.”
| Operation (s) | Clean | Blog | WooCommerce | Industry avg |
|---|---|---|---|---|
| MySQL | 1.33 | 0.78 | 0.74 | 2.9 |
| WordPress Time | 2.88 | 2.58 | 2.55 | 0.9 |
| String | ~0.16 | ~0.15 | ~0.15 | 0.2 |
| Math / Loops / Conditionals | ~0.1 | ~0.07 | ~0.07 | ~0 |
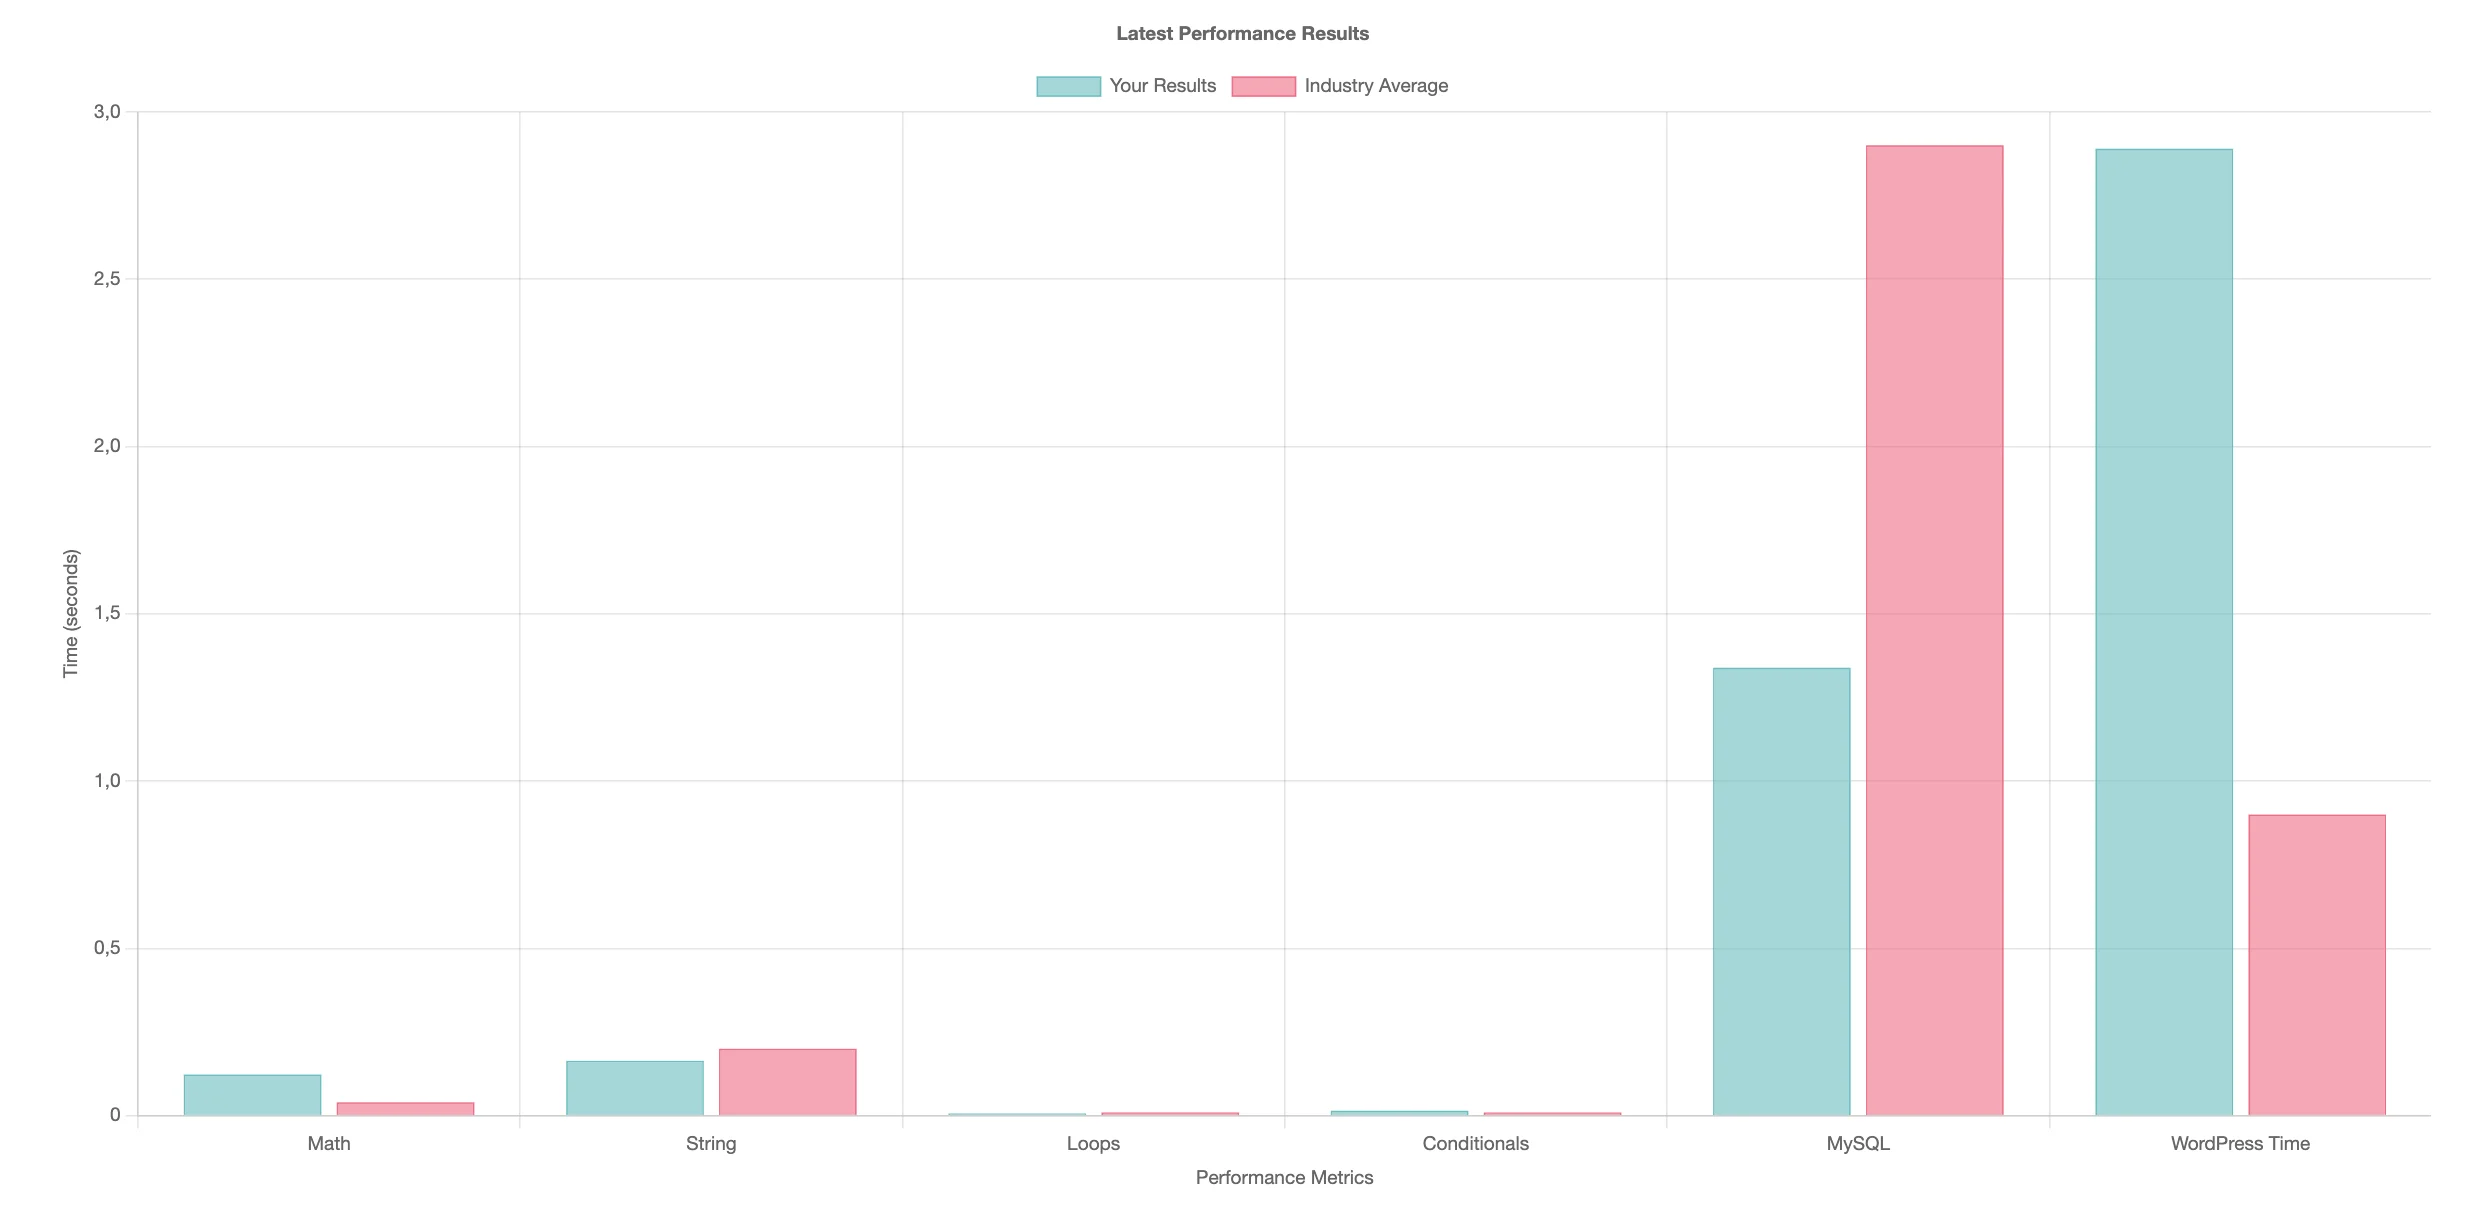
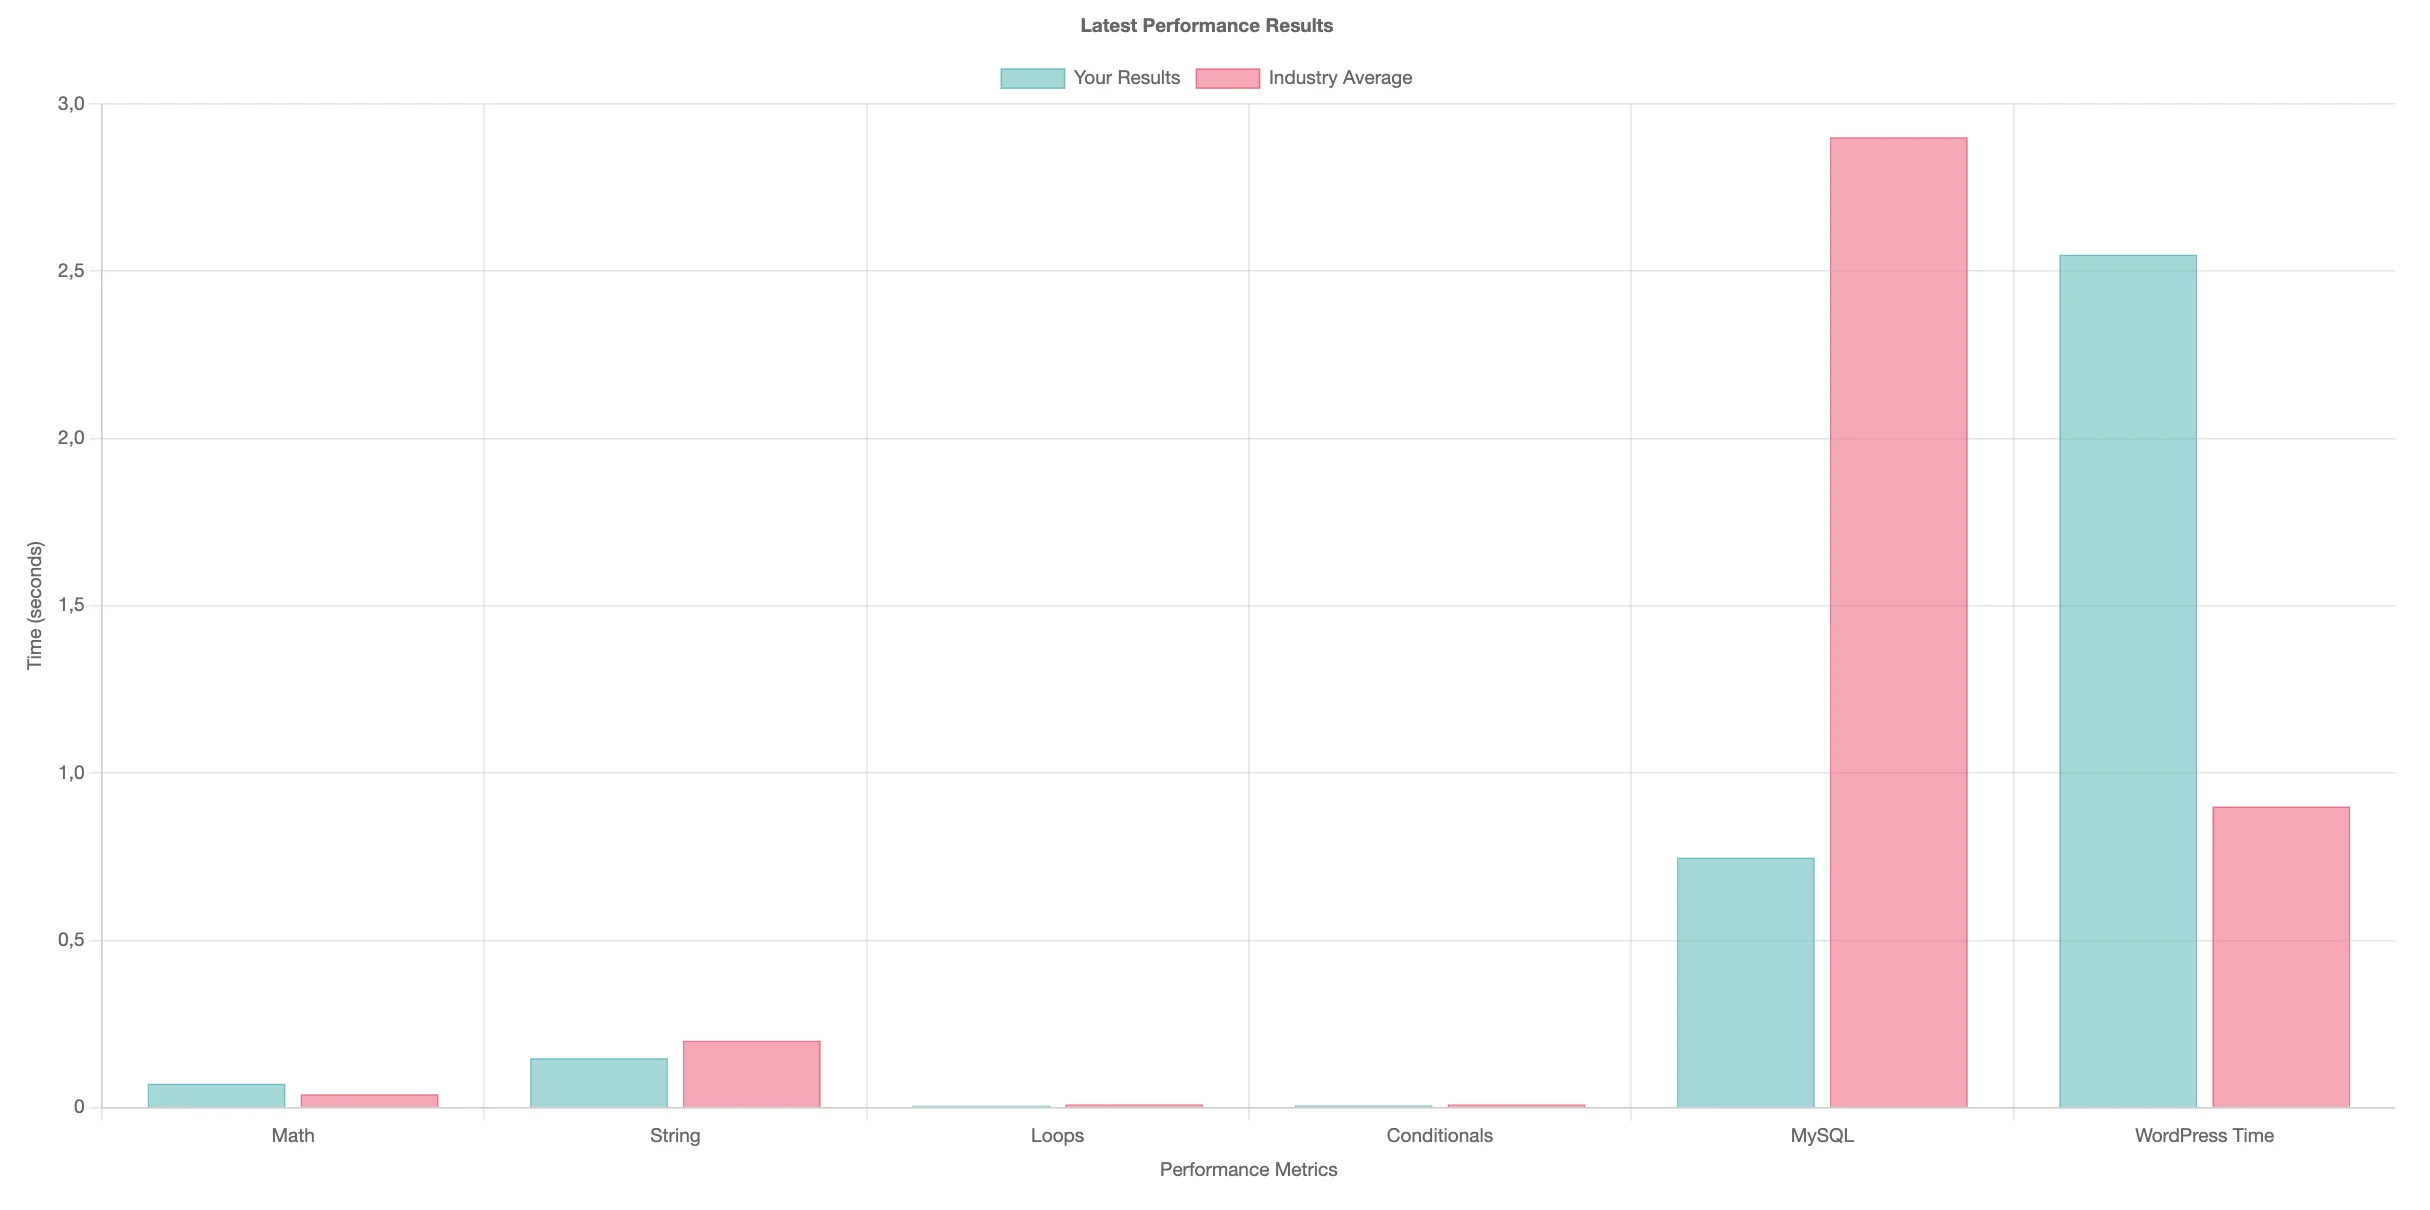
MySQL is comfortably faster than the industry average (0.74–1.33 s vs 2.9 s) — the metric that matters most for WordPress and WooCommerce, where the database is usually the bottleneck.
One result I want to flag honestly: the synthetic “WordPress Time” came in high (2.5–2.9 s vs a 0.9 s average). Taken alone that looks bad — but it directly contradicts the real-world page-generation numbers from Query Monitor below (0.05 s on a clean page). My read: this particular synthetic sub-test stresses something the SpeedTest plugin weights heavily that doesn't reflect how an actual page renders here. I'd trust Query Monitor's real timings over this synthetic figure, but I'm reporting both rather than hiding the one that's less flattering.
Network throughput
| Transfer (MB/s) | Clean | Blog | WooCommerce | Industry avg |
|---|---|---|---|---|
| Download 10 MB | ~53 | ~51 | ~47.5 | 10 |
| Upload 10 MB | ~24.5 | ~38.5 | ~30.8 | 4 |
| Download 1 MB | ~8.2 | ~9 | ~8.6 | 15 |
| Upload/Download 10 K, 100 K | low | low | low | 8–10 |
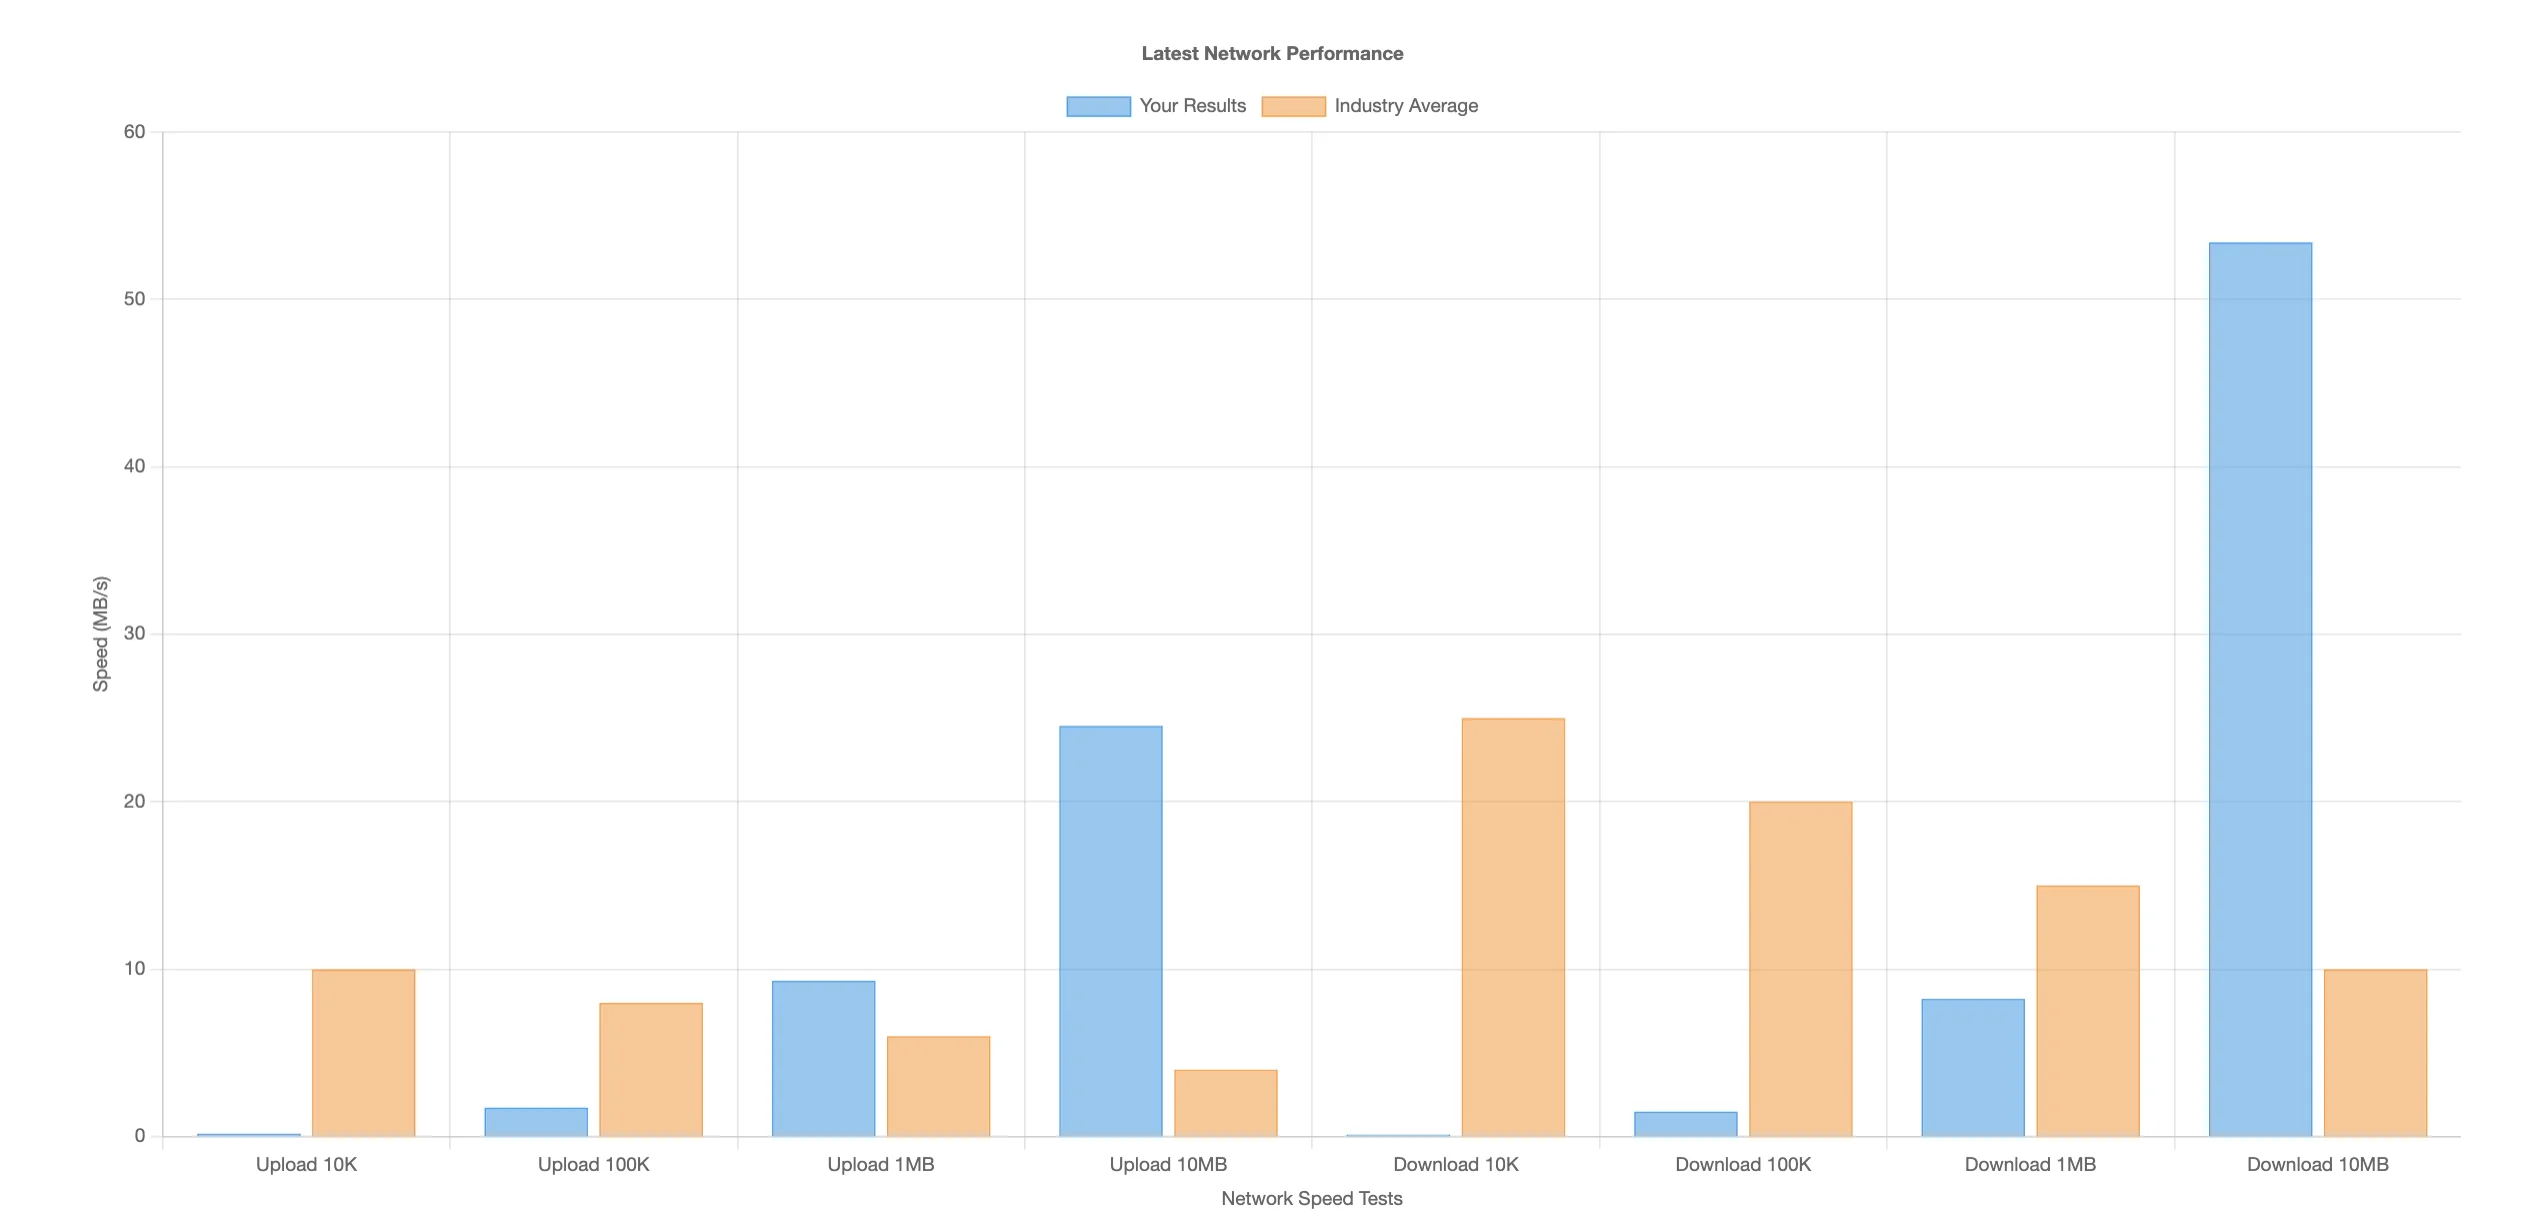
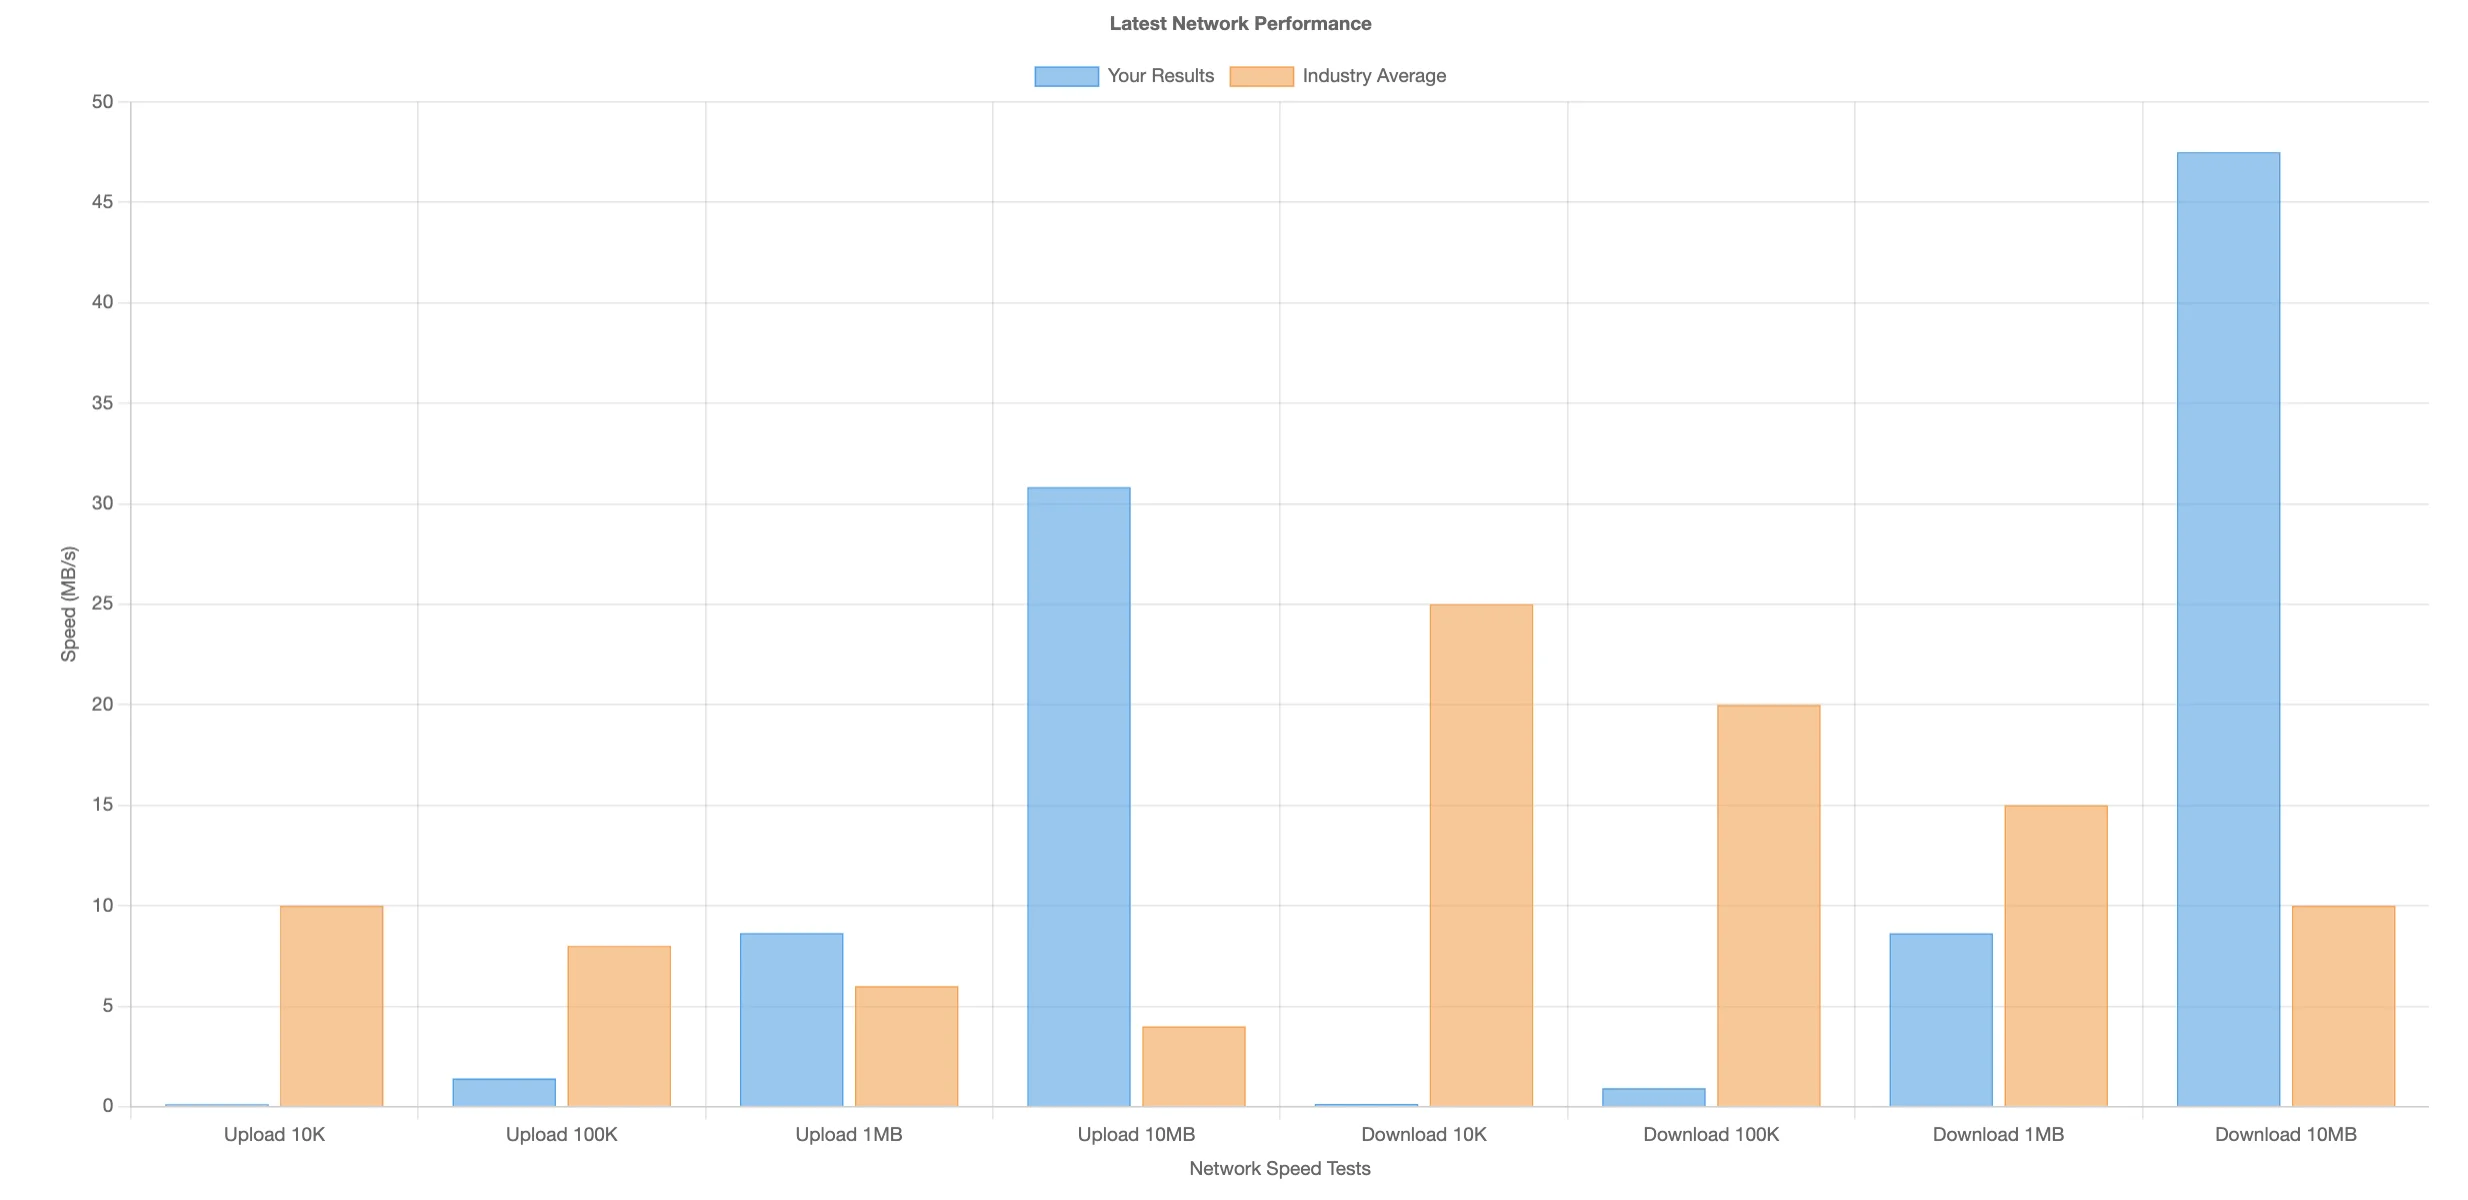
Large-file throughput is excellent — ~47–53 MB/s download on a 10 MB file versus a 10 MB/s average, and uploads several times above average — which is great for serving media and large assets. Small files (10 K/100 K) come in below average; that's the usual story where per-request overhead dominates tiny transfers, and in practice it's smoothed out by caching and HTTP/2.
Results: Query Monitor
Query Monitor shows the number that matters most — how long the server actually takes to build a page:
| Site | Page generation | Peak memory | DB queries | DB query time | Object cache hit |
|---|---|---|---|---|---|
| Clean WordPress | 0.0526 s | 6.8 MB (1.3%) | 24 | 0.0023 s | 94.9% |
| WordPress Blog | 0.0813 s | 11.4 MB (2.2%) | 36 | 0.0015 s | 95.0% |
| WooCommerce e-shop | 0.3223 s | 28.6 MB (5.6%) | 106 | 0.0109 s | 93.0% |

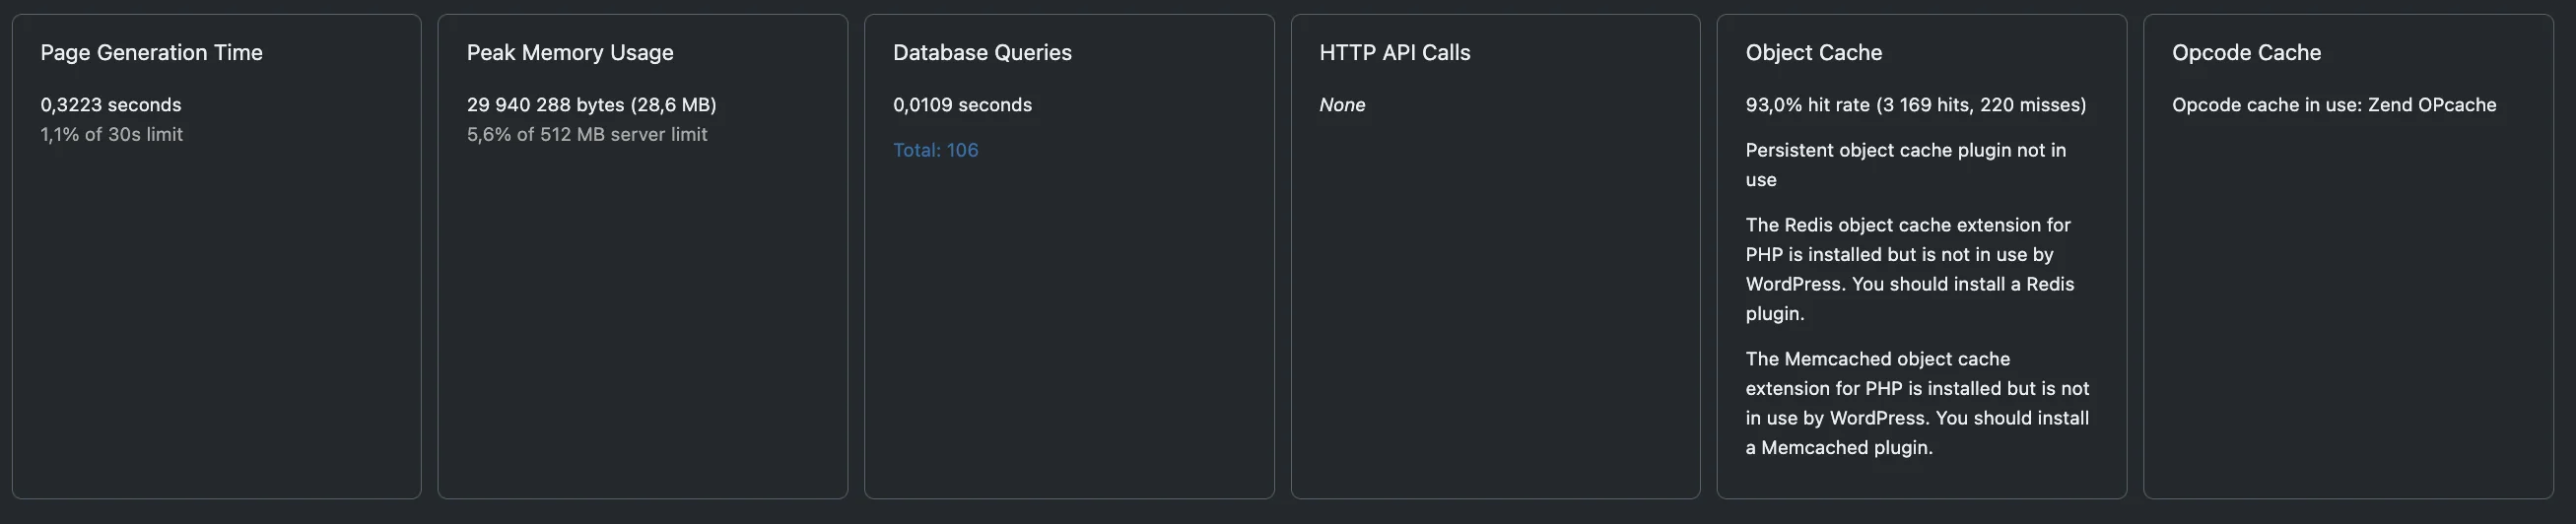
This is where ScalaHosting looks genuinely fast. A clean page builds in 0.05 s, and the 1,000-product WooCommerce homepage in 0.32 s with 106 queries executed in just 0.011 s. There were no external HTTP API calls inflating any of the timings (a problem I've seen drag down other hosts' blog results). Database time is tiny across the board, echoing the SpeedTest MySQL result.
One easy win is being left on the table: Query Monitor flags that Redis (and Memcached) are installed on the server but WordPress isn't using them for object caching. The internal cache still hit 93–95%, but anyone chasing maximum performance should install a Redis object-cache plugin and switch persistent caching on — SPanel even has a Redis Cache tile for it.
Results: load tests (k6.io)
This is the section that separates hosts, and where ScalaHosting did something several of the hosts I tested didn’t: it took the load without dropping requests. I ran three scenarios — a short sharp spike, a ramp up/down, and a long sustained load — on each site.
Spike test
| Site | Requests | Failures | Peak RPS | P95 response |
|---|---|---|---|---|
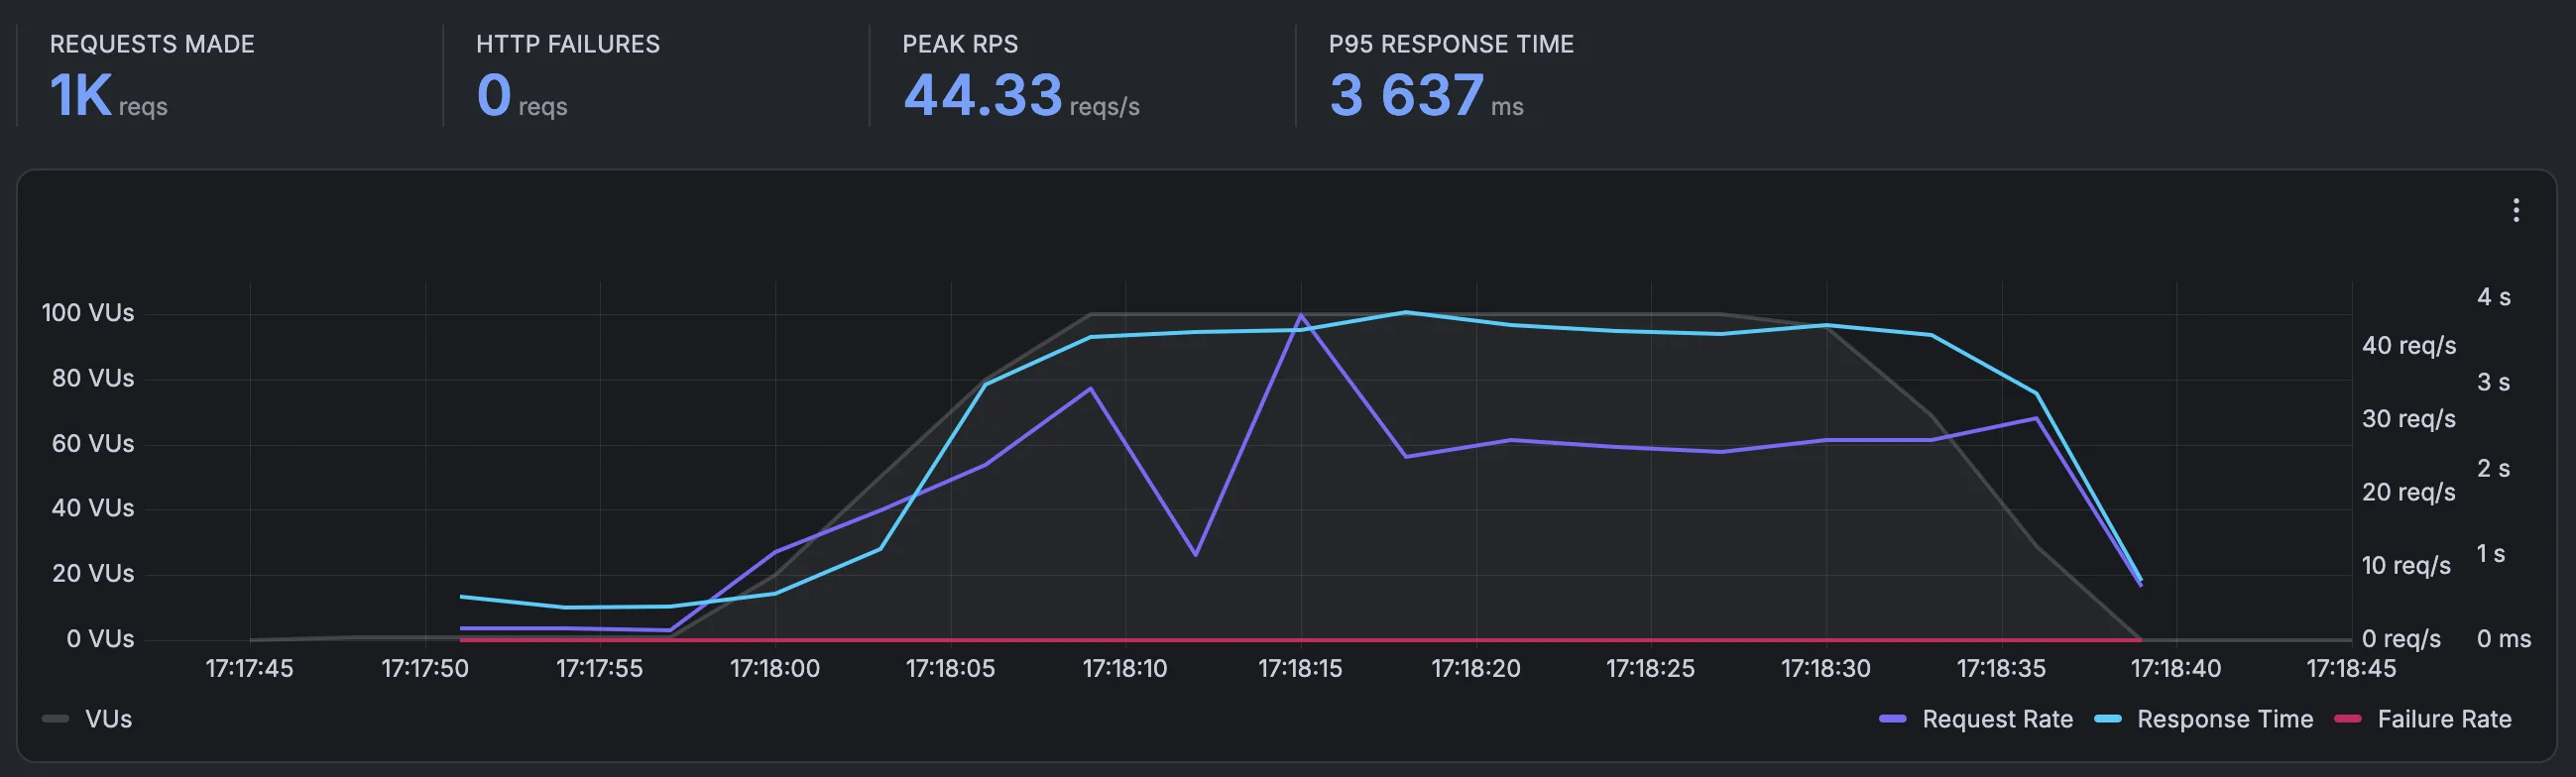
| Clean WordPress | 1,000 | 0 | 44.3 | 3,637 ms |
| WordPress Blog | 358 | 0 | 29.3 | 17,452 ms |
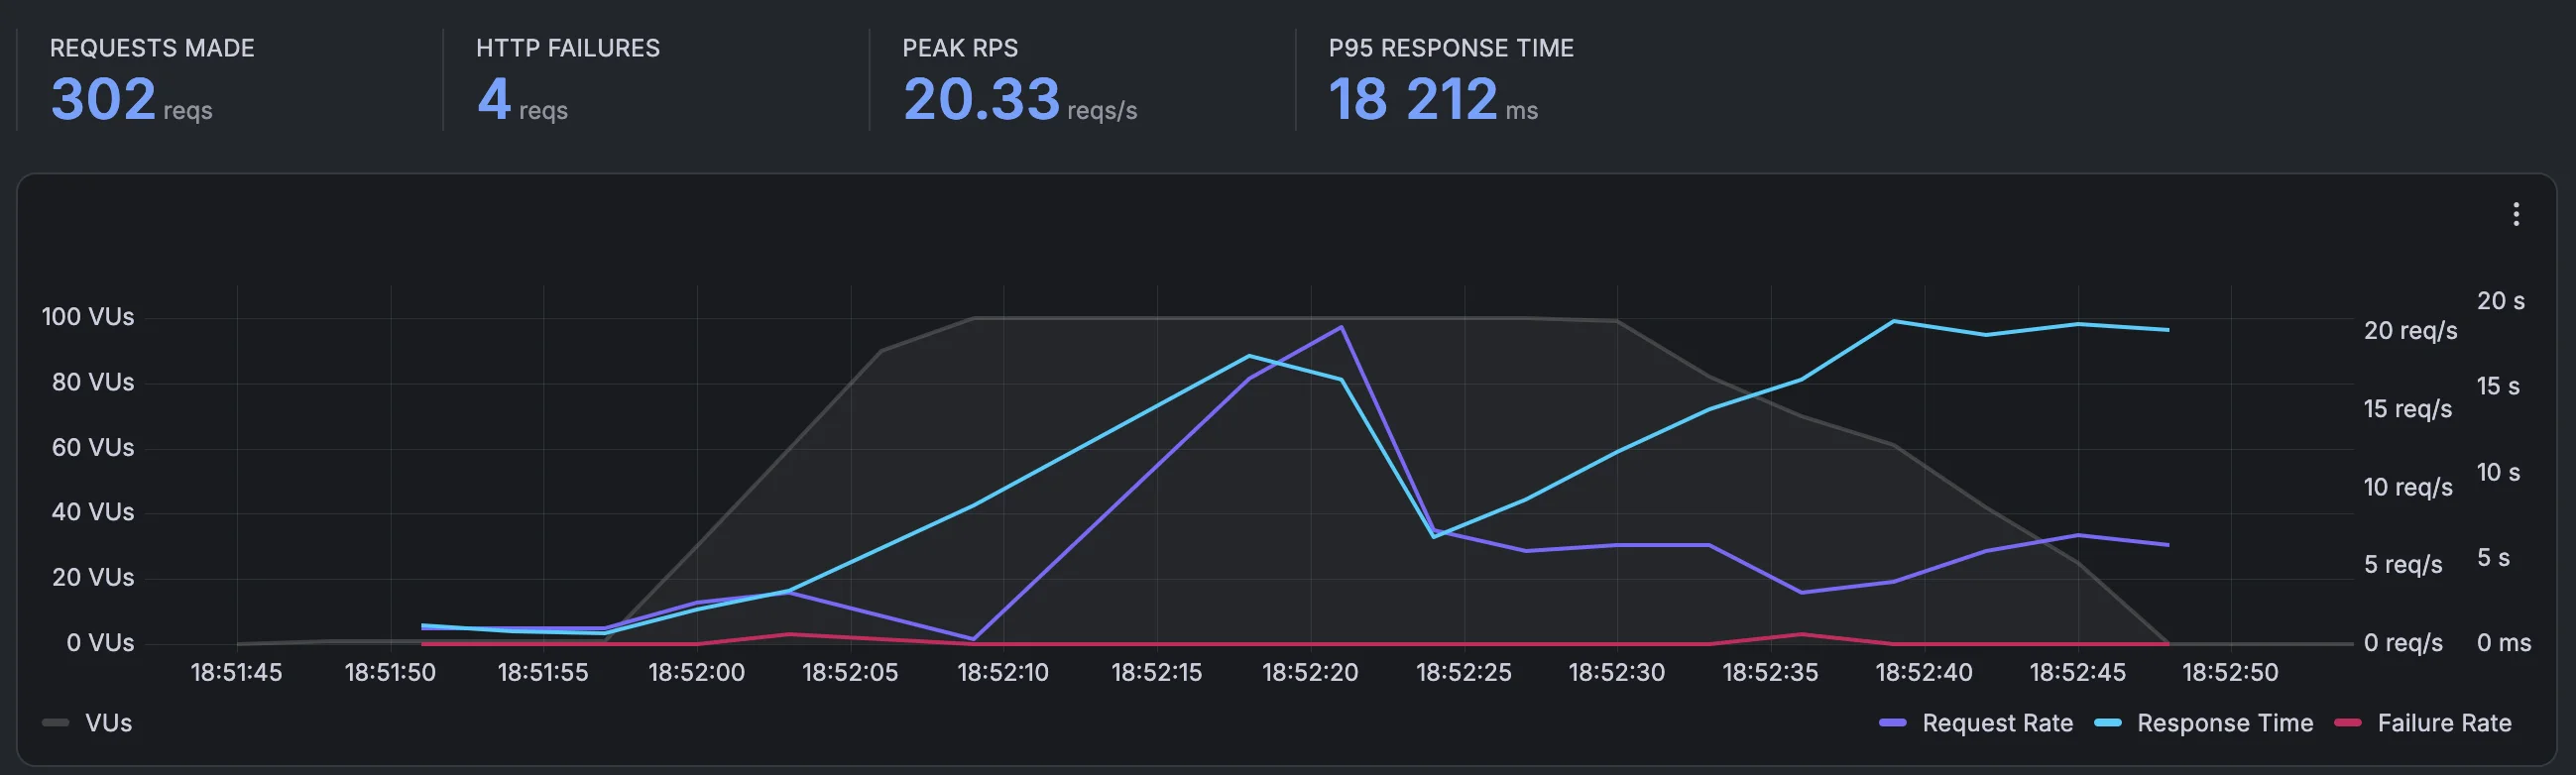
| WooCommerce e-shop | 302 | 4 | 20.3 | 18,212 ms |
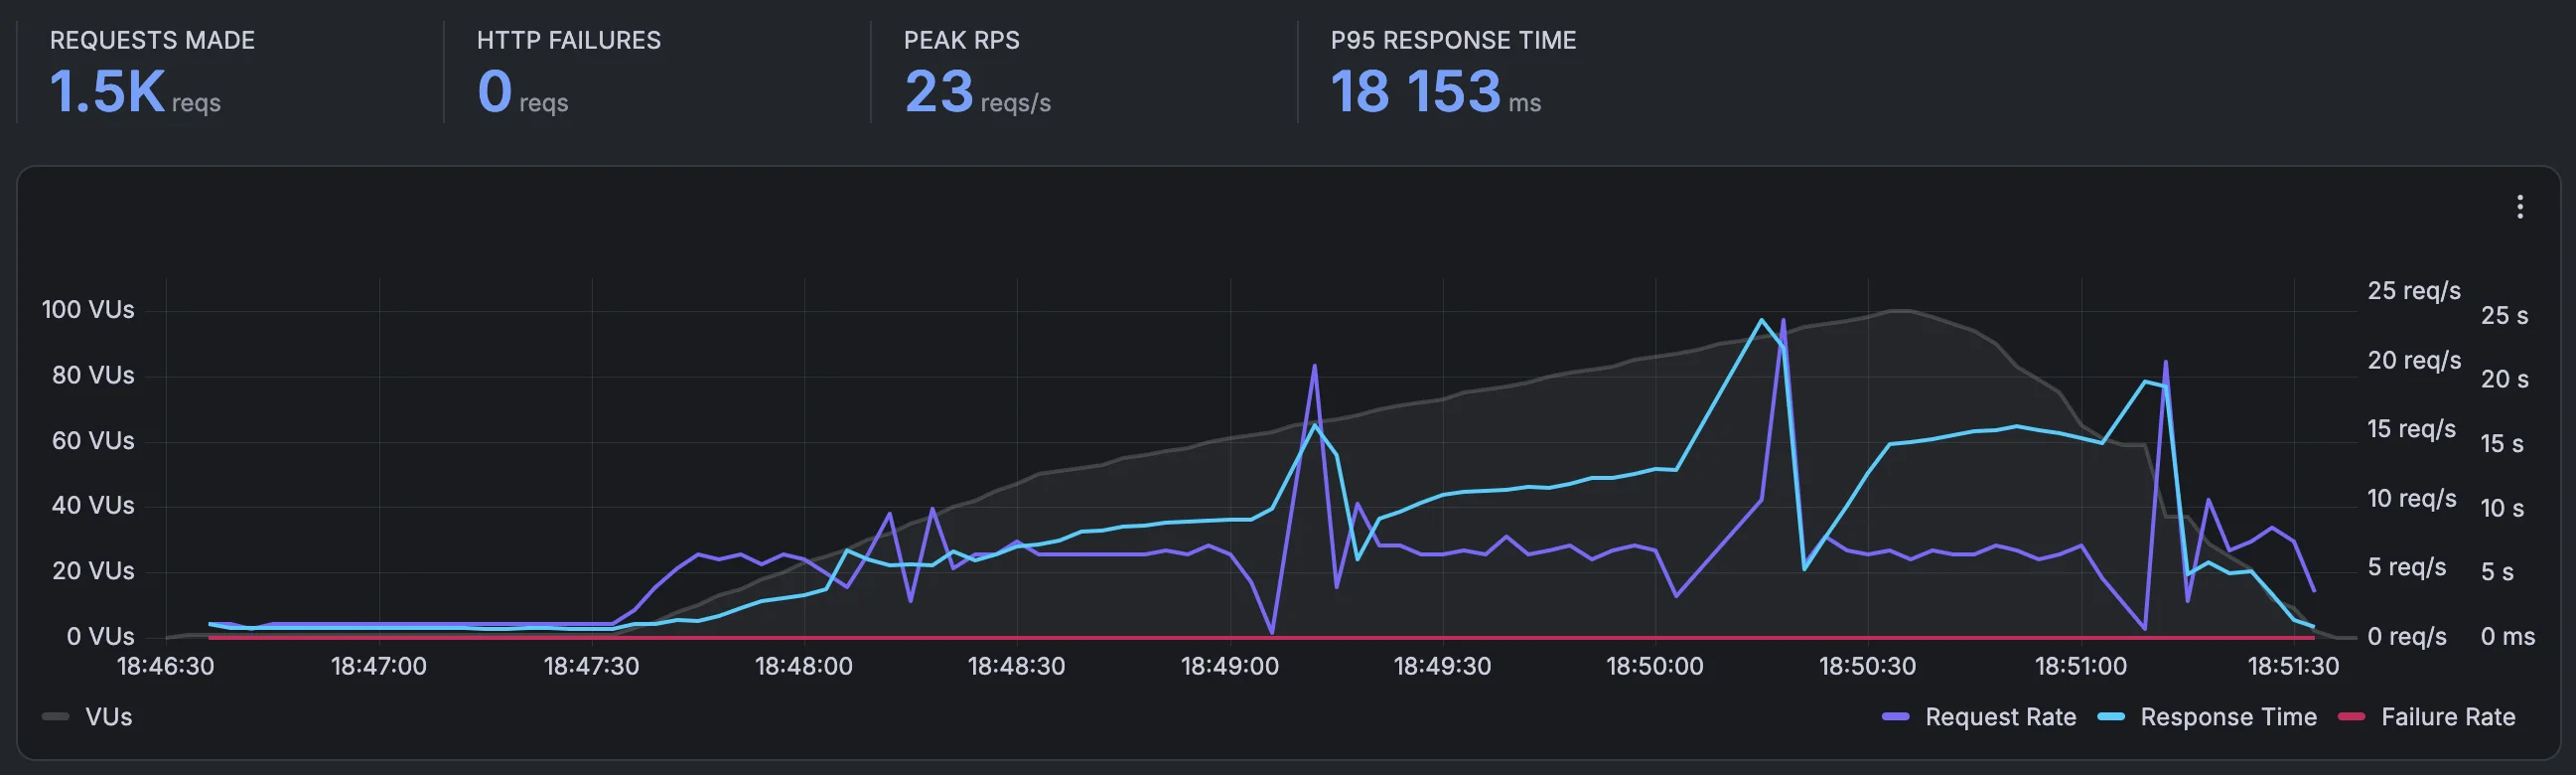
Ramp up/down test
| Site | Requests | Failures | Peak RPS | P95 response |
|---|---|---|---|---|
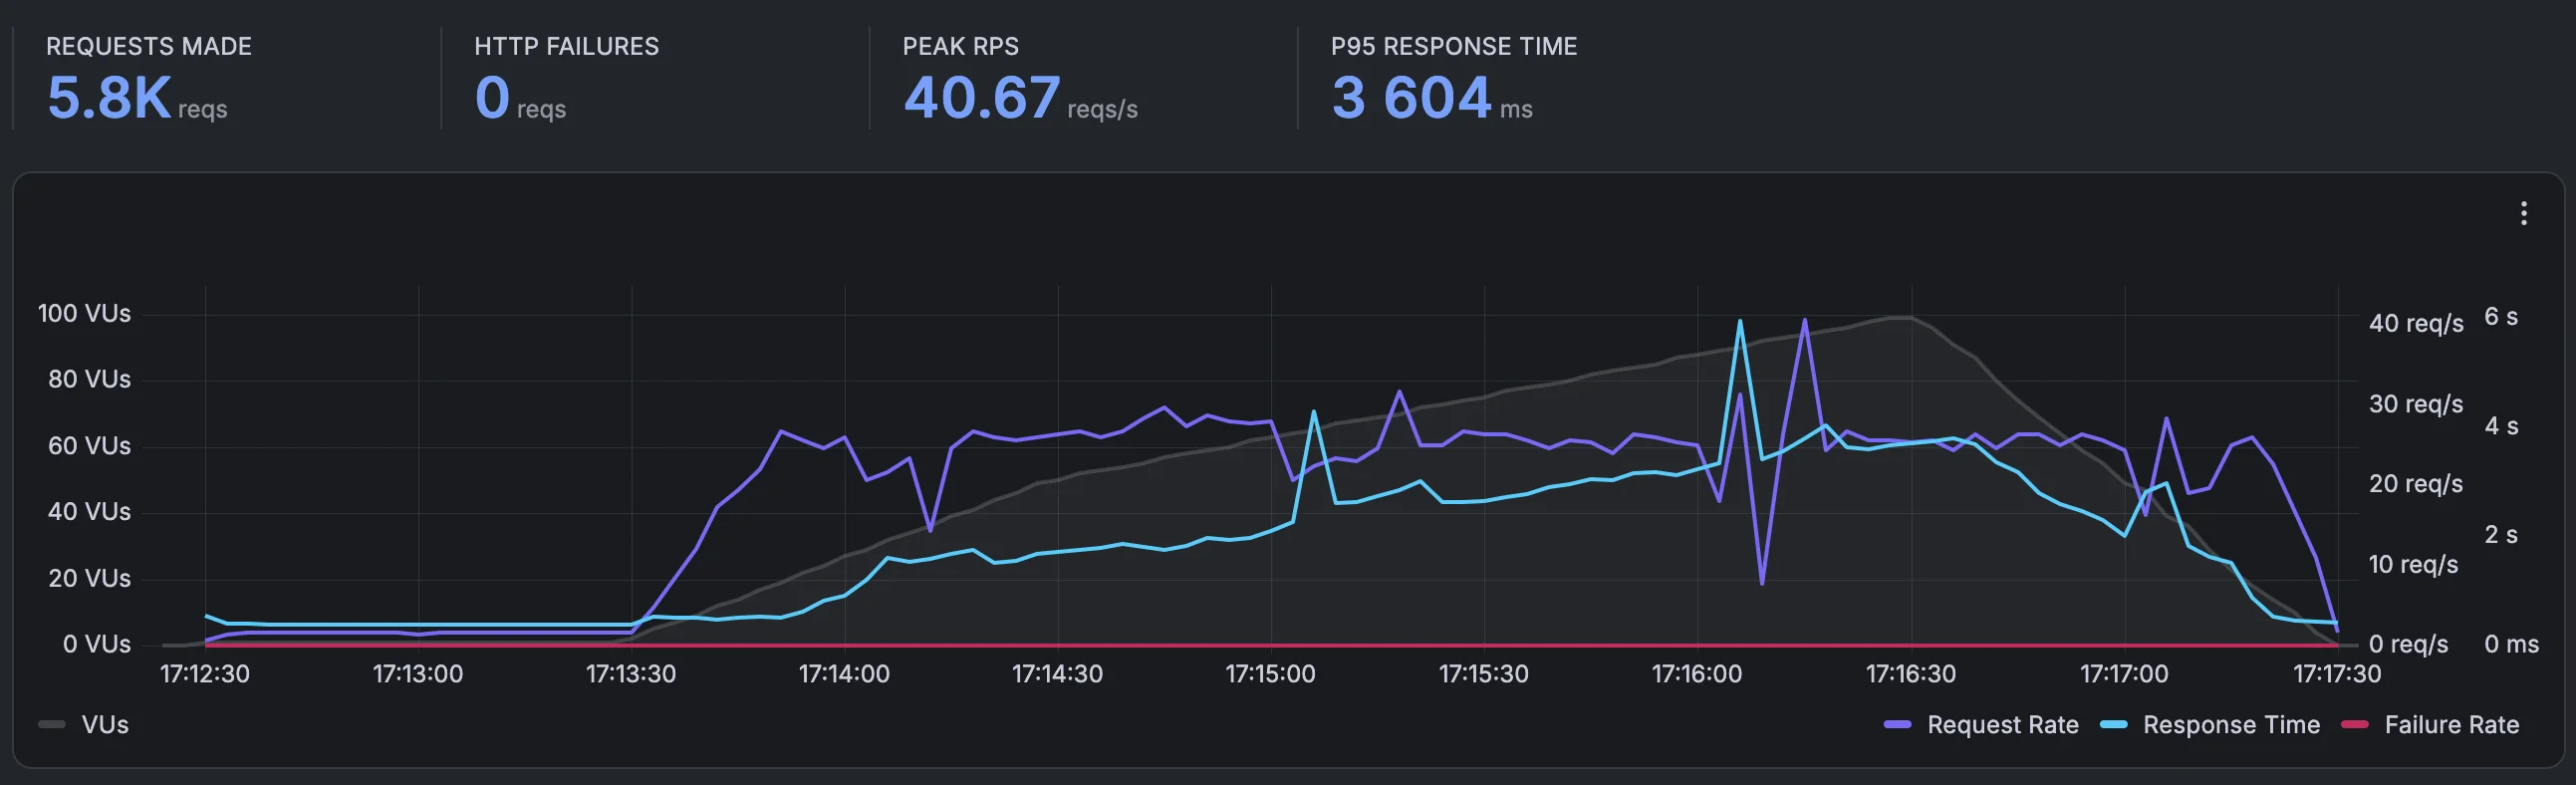
| Clean WordPress | 5,800 | 0 | 40.7 | 3,604 ms |
| WordPress Blog | 1,200 | 0 | 27.0 | 15,211 ms |
| WooCommerce e-shop | 1,500 | 0 | 23.0 | 18,153 ms |
Sustained load test
| Site | Requests | Failures | Peak RPS | P95 response |
|---|---|---|---|---|
| Clean WordPress | 16,000 | 0 | 38.5 | 4,162 ms |
| WordPress Blog | 1,500 | 0 | 22.3 | 18,743 ms |
| WooCommerce e-shop | 1,300 | 0 | 18.0 | 25,166 ms |
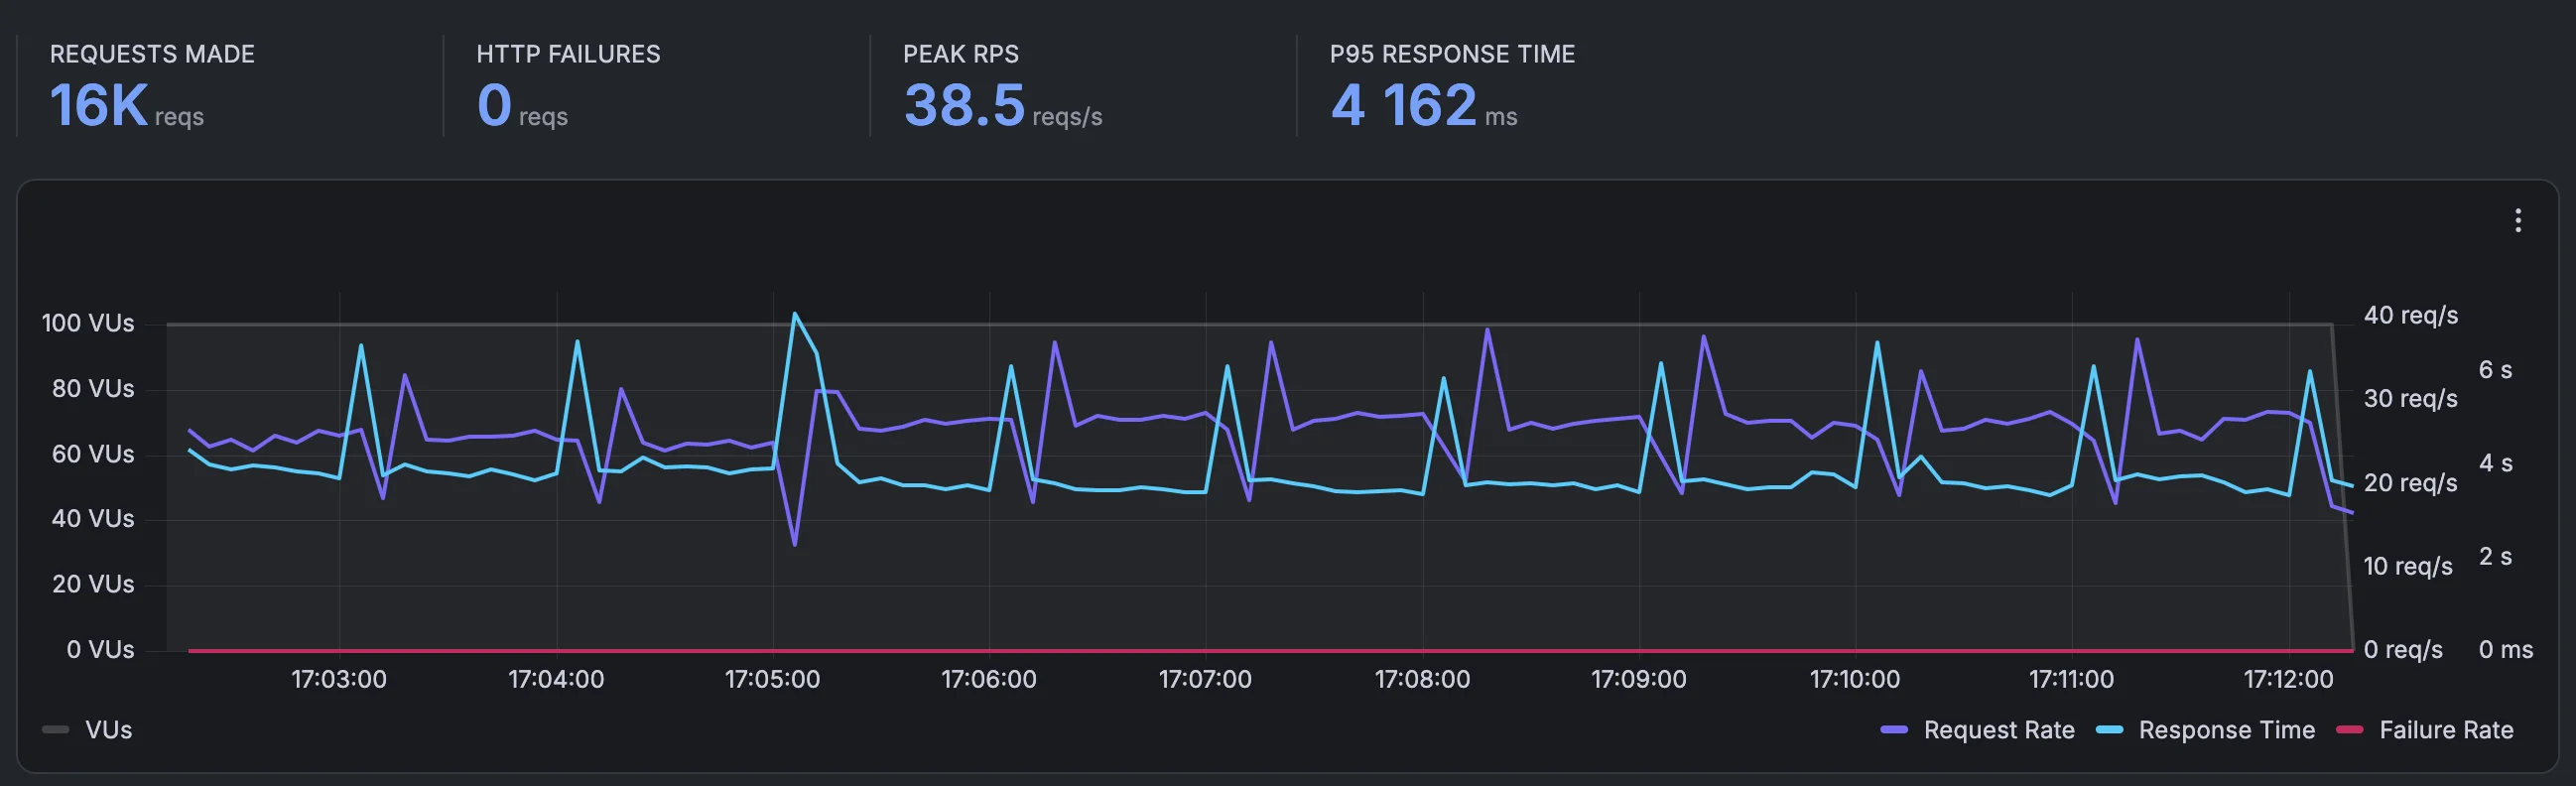
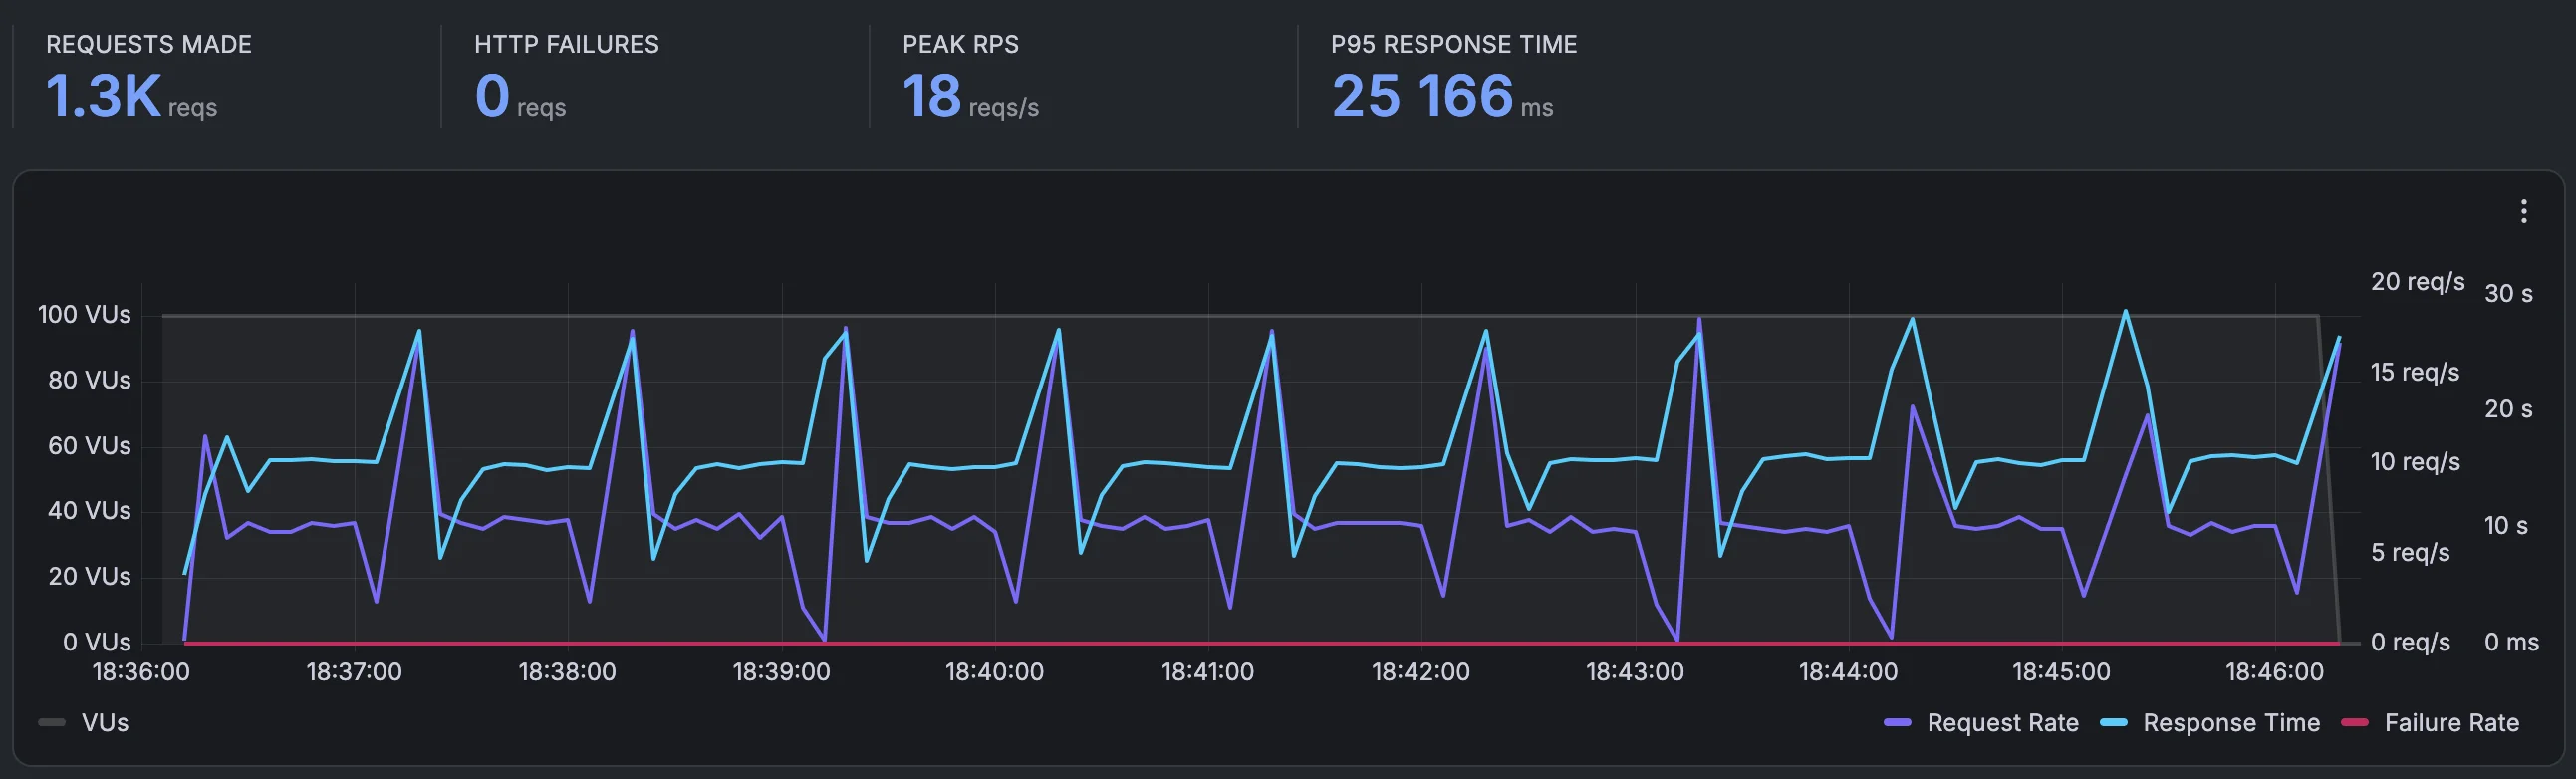
Two things stand out, and they pull in different directions.
The good — and it's a big deal: the failure rate was essentially zero across every scenario, including the long sustained run that pushed 16,000 requests through the clean site. Only the WooCommerce spike logged 4 failed requests out of 302. On other hosts I've reviewed, sustained load from a single IP triggers rate-limiting or a WAF and the failure rate jumps toward 100%; here it didn't. ScalaHosting kept serving real responses the whole time, which is exactly what you want from a managed VPS.
The honest caveat: P95 response times climb steeply under load on the heavier sites. The clean install stayed reasonable (P95 ~3.6–4.2 s), but the blog and shop stretched to 15–25 s at P95 under sustained pressure. That's not the server falling over — it's a 2 vCPU / 2 GB box queuing requests instead of rejecting them, on uncached, dynamic WooCommerce pages. The fix is the usual one: enable full-page and object caching (Redis is right there), and/or step up to a larger build — the resources are configurable precisely for this. For a low-traffic blog or brochure site the entry plan is fine; for a busy uncached shop you'd want more cores or a caching layer.
Re-test on the tuned LiteSpeed + LSCache + Redis stack
There's an important caveat to everything above: the box I tested was running ScalaHosting's default Apache configuration, with Redis installed but not enabled and no LiteSpeed cache — essentially the un-tuned baseline. ScalaHosting fairly pointed out that the product is designed to run on its OpenLiteSpeed/LiteSpeed stack with LSCache and the Redis object cache switched on, and that this is precisely the fix for the P95-under-load behaviour I flagged. That's a reasonable methodology point, so I re-ran the heaviest build — the 1,000-product WooCommerce shop, where the latency problem showed up — on a properly tuned configuration and compared it against the baseline.
How I tuned it
The switch is genuinely a few clicks in SPanel. In the Web Server Manager I changed the web server from Apache to OpenLiteSpeed — a one-click swap SPanel applies for you (it re-detects .htaccess changes and restarts the server within 30 minutes). SPanel's own "HTTP/2 performance by server" chart makes the case for the switch: OpenLiteSpeed with LSCache benchmarks far above Apache with W3 Total Cache on the same box.
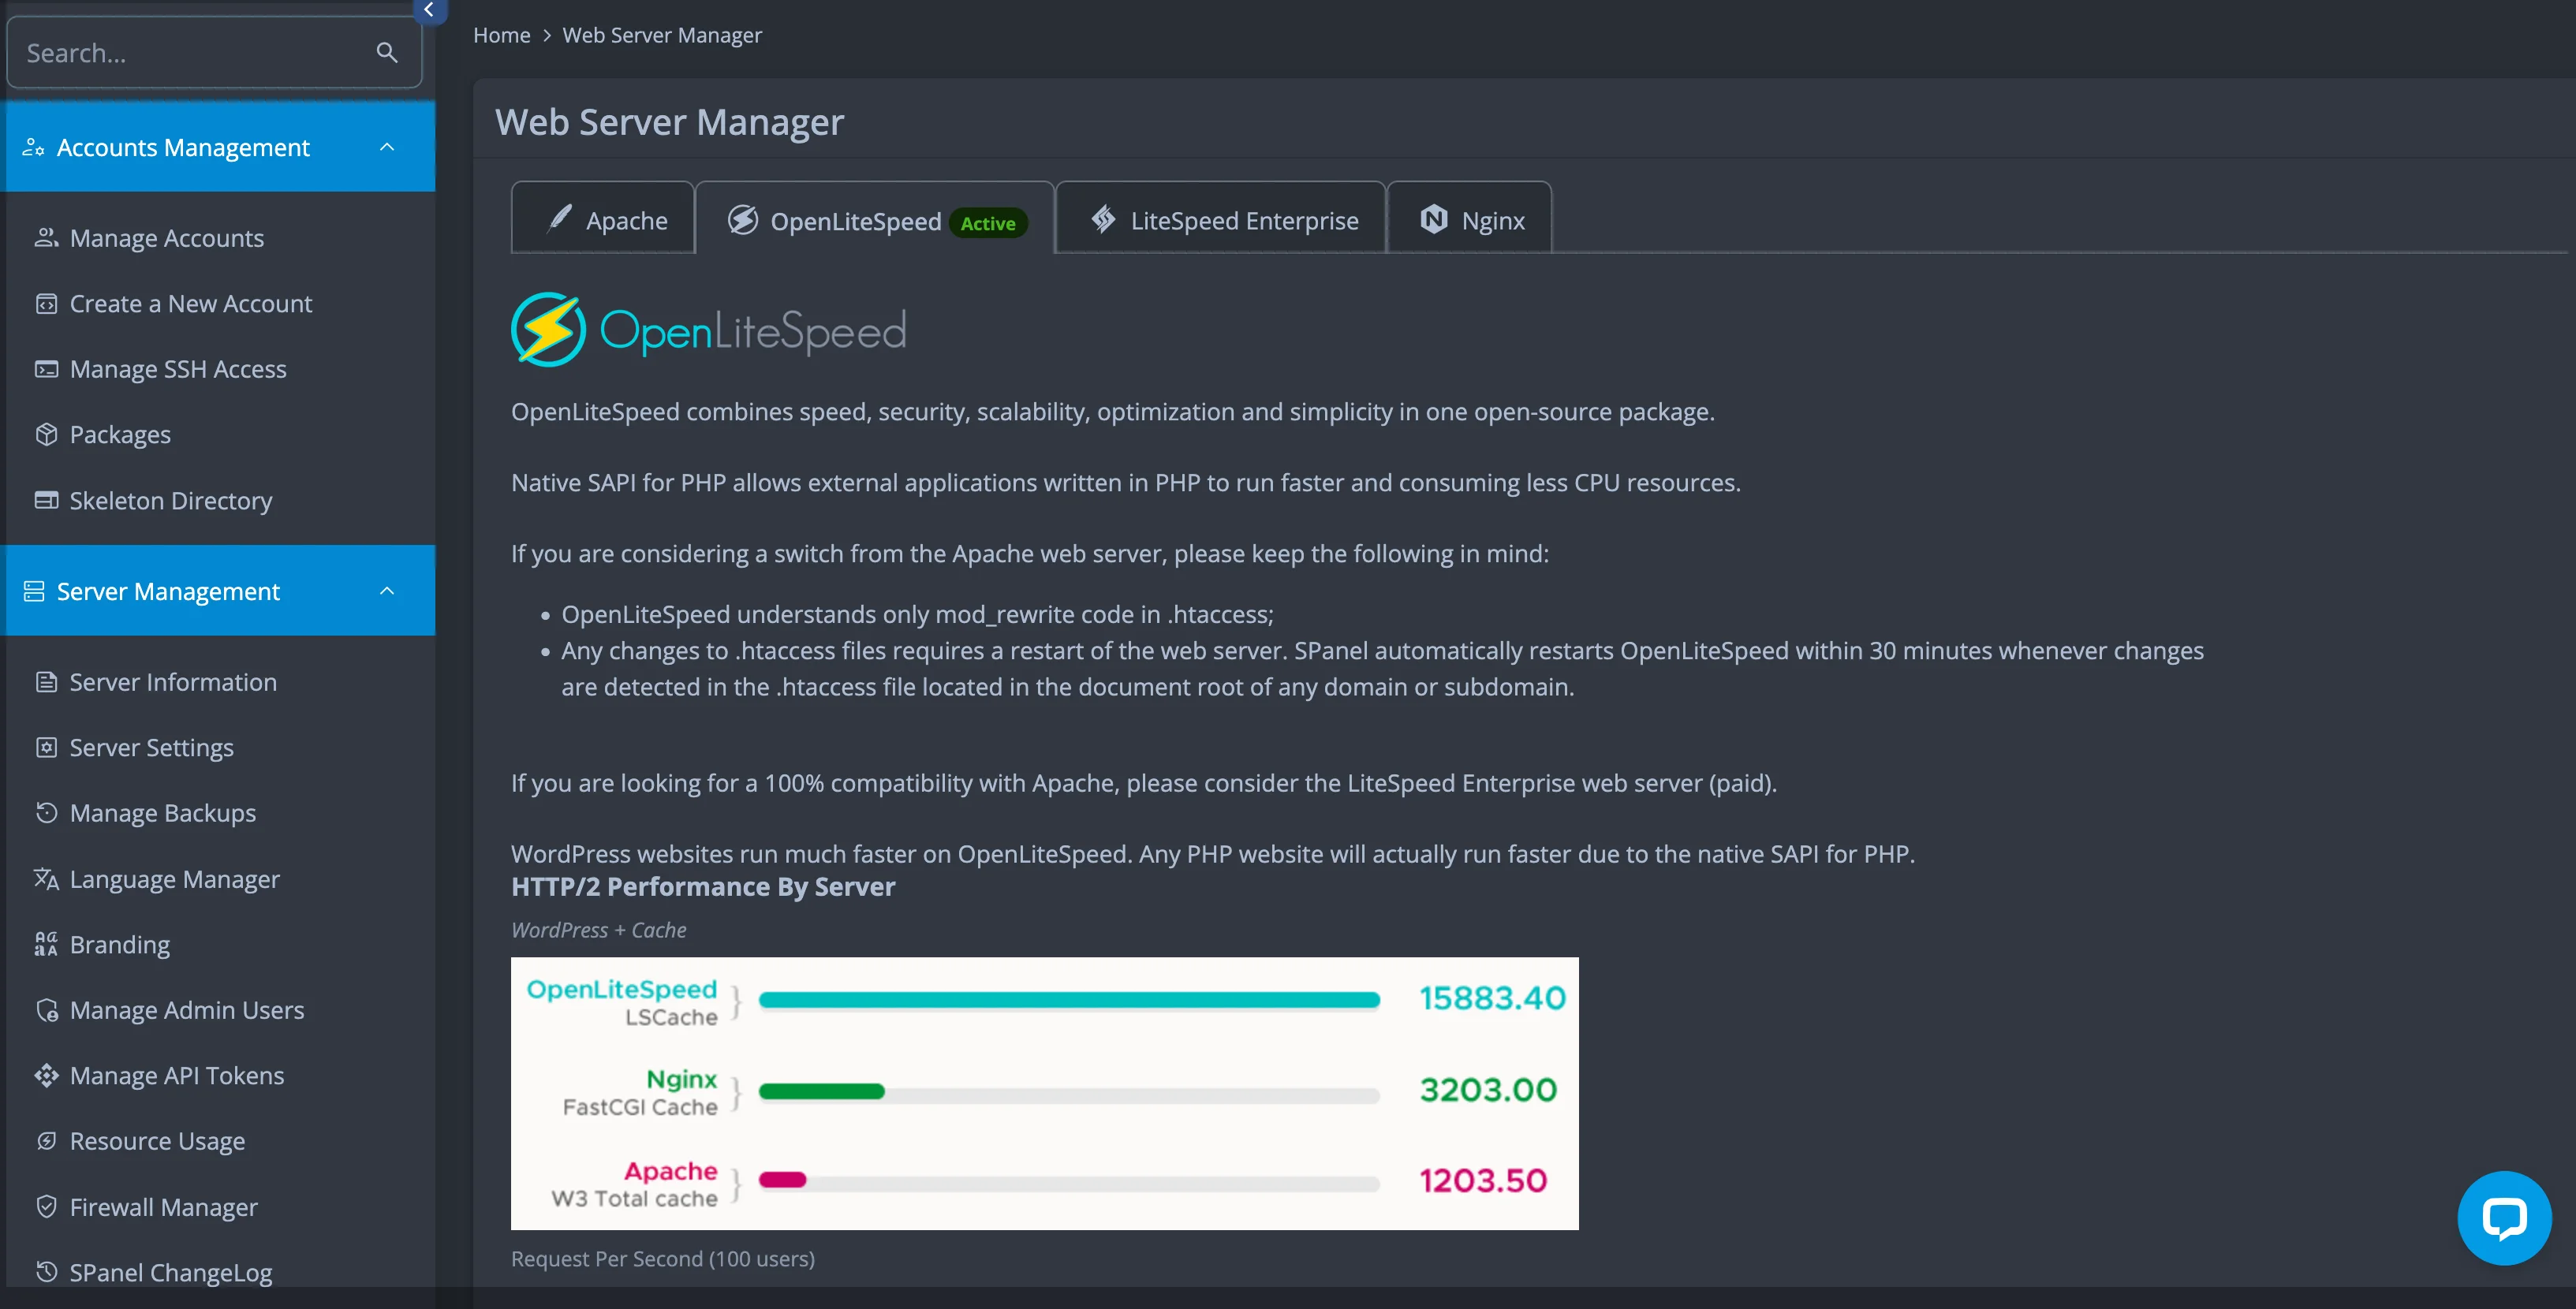
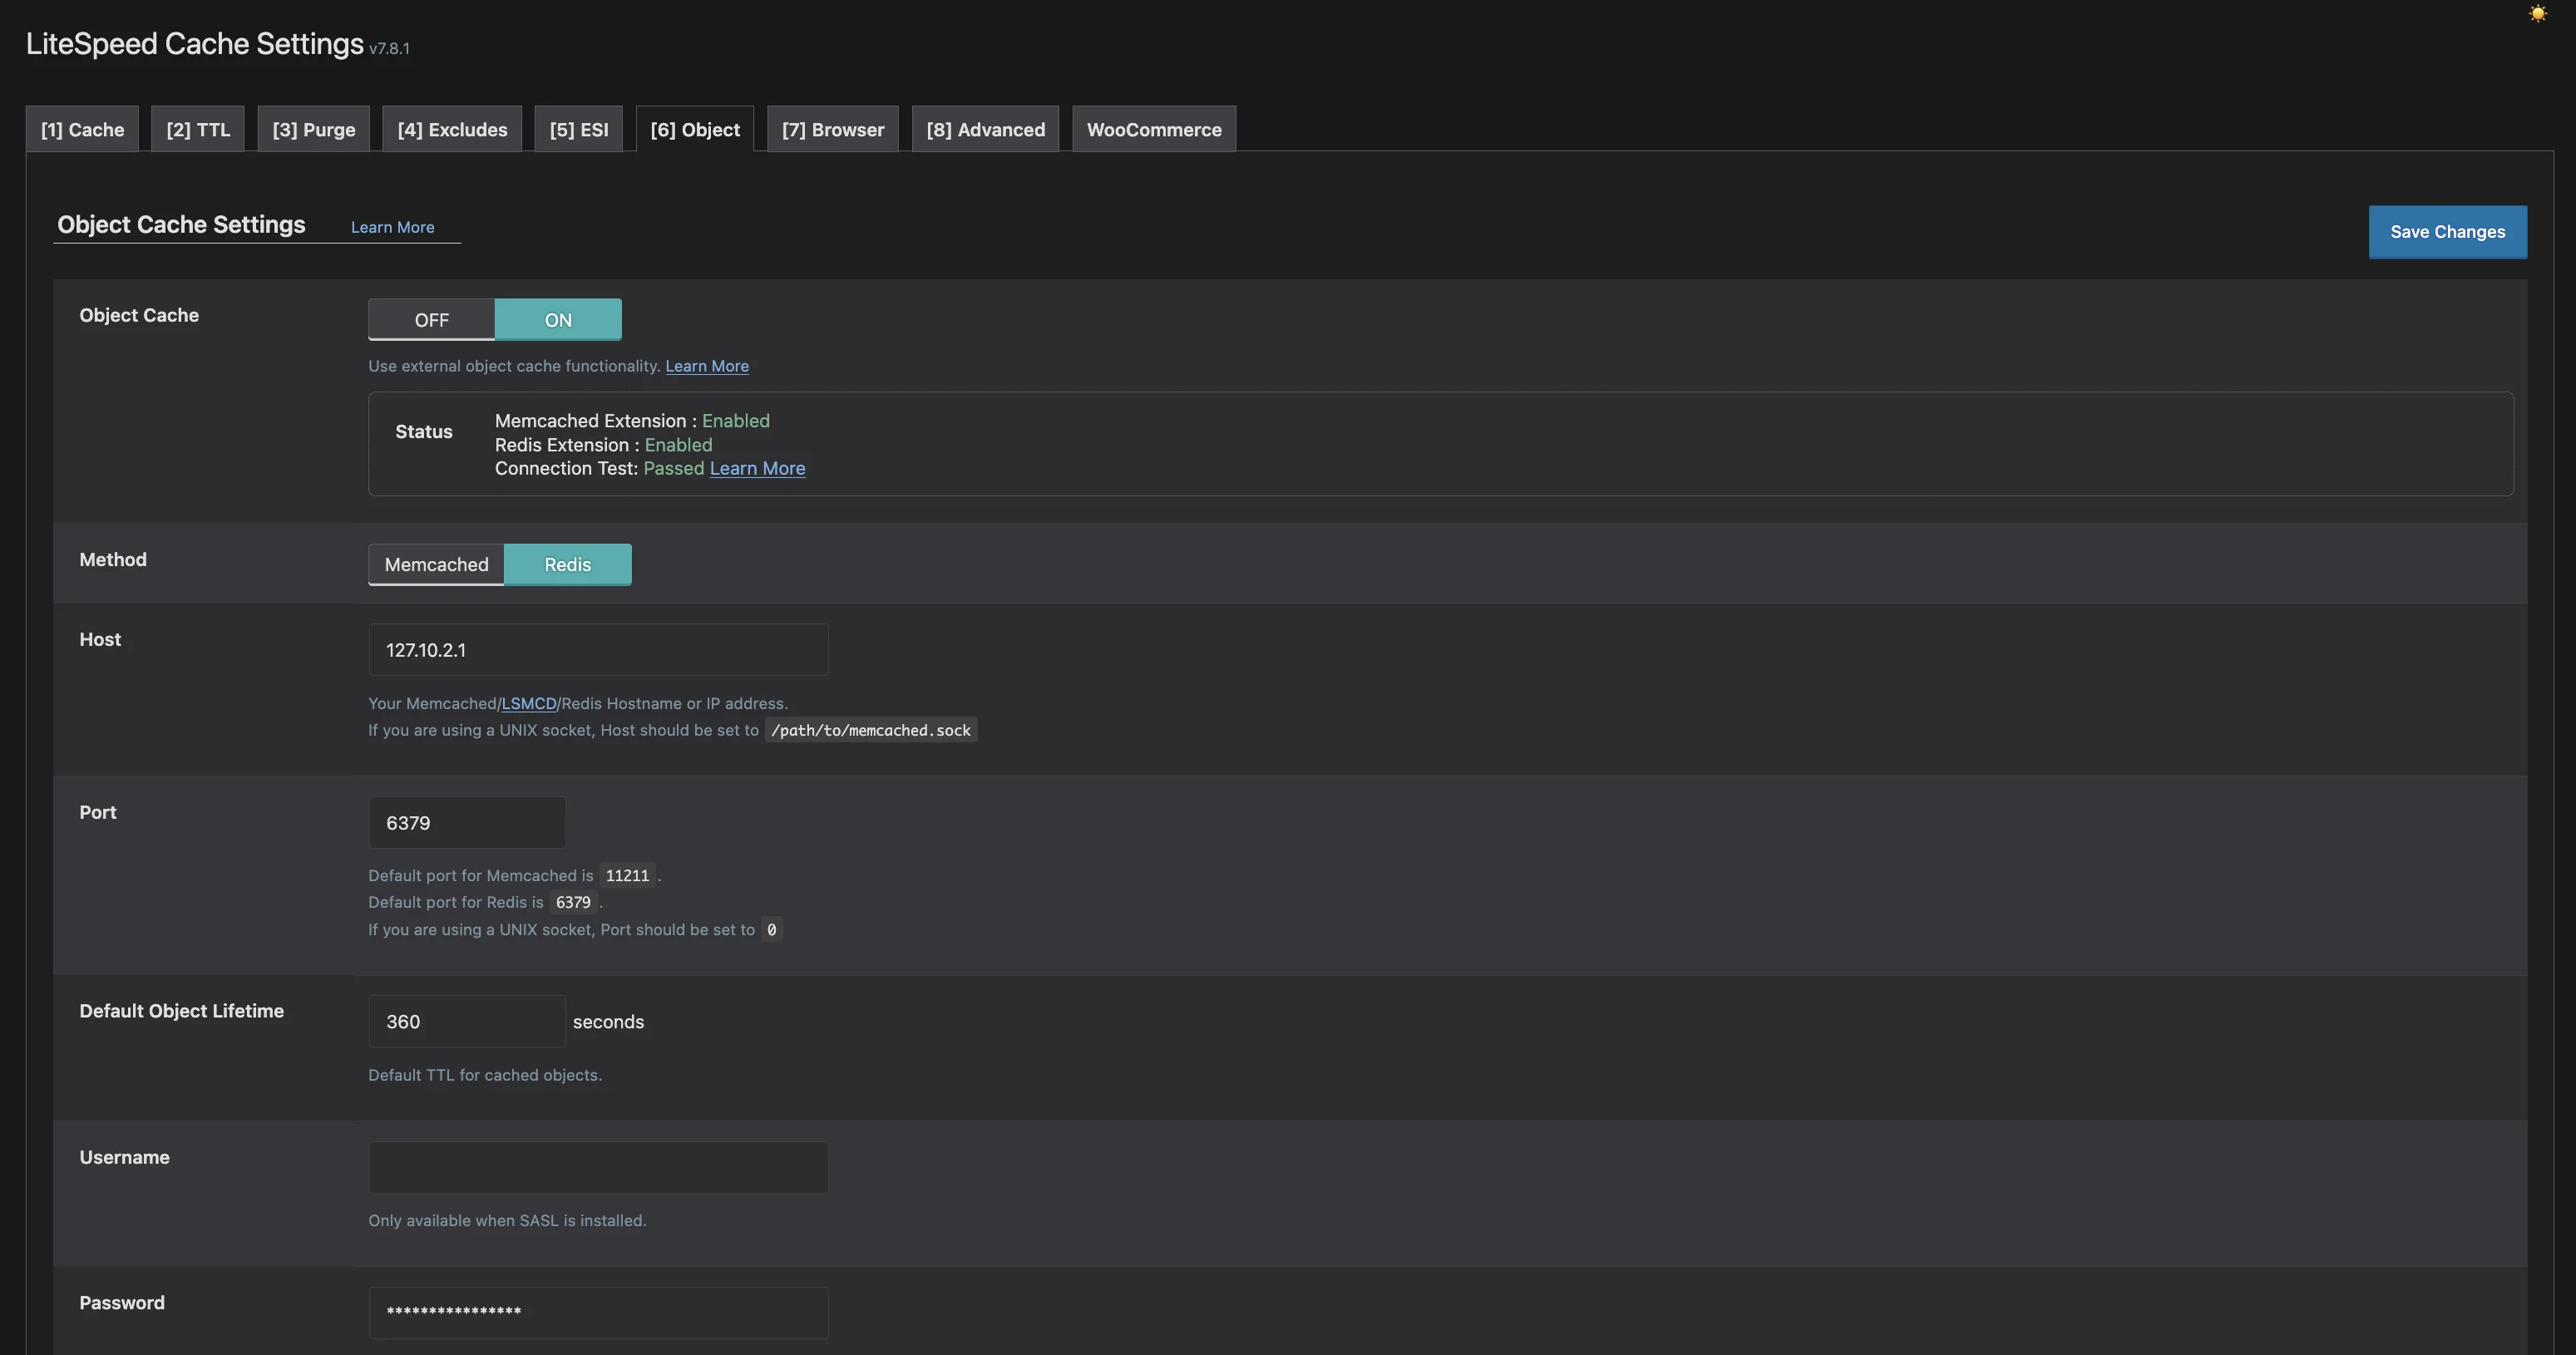
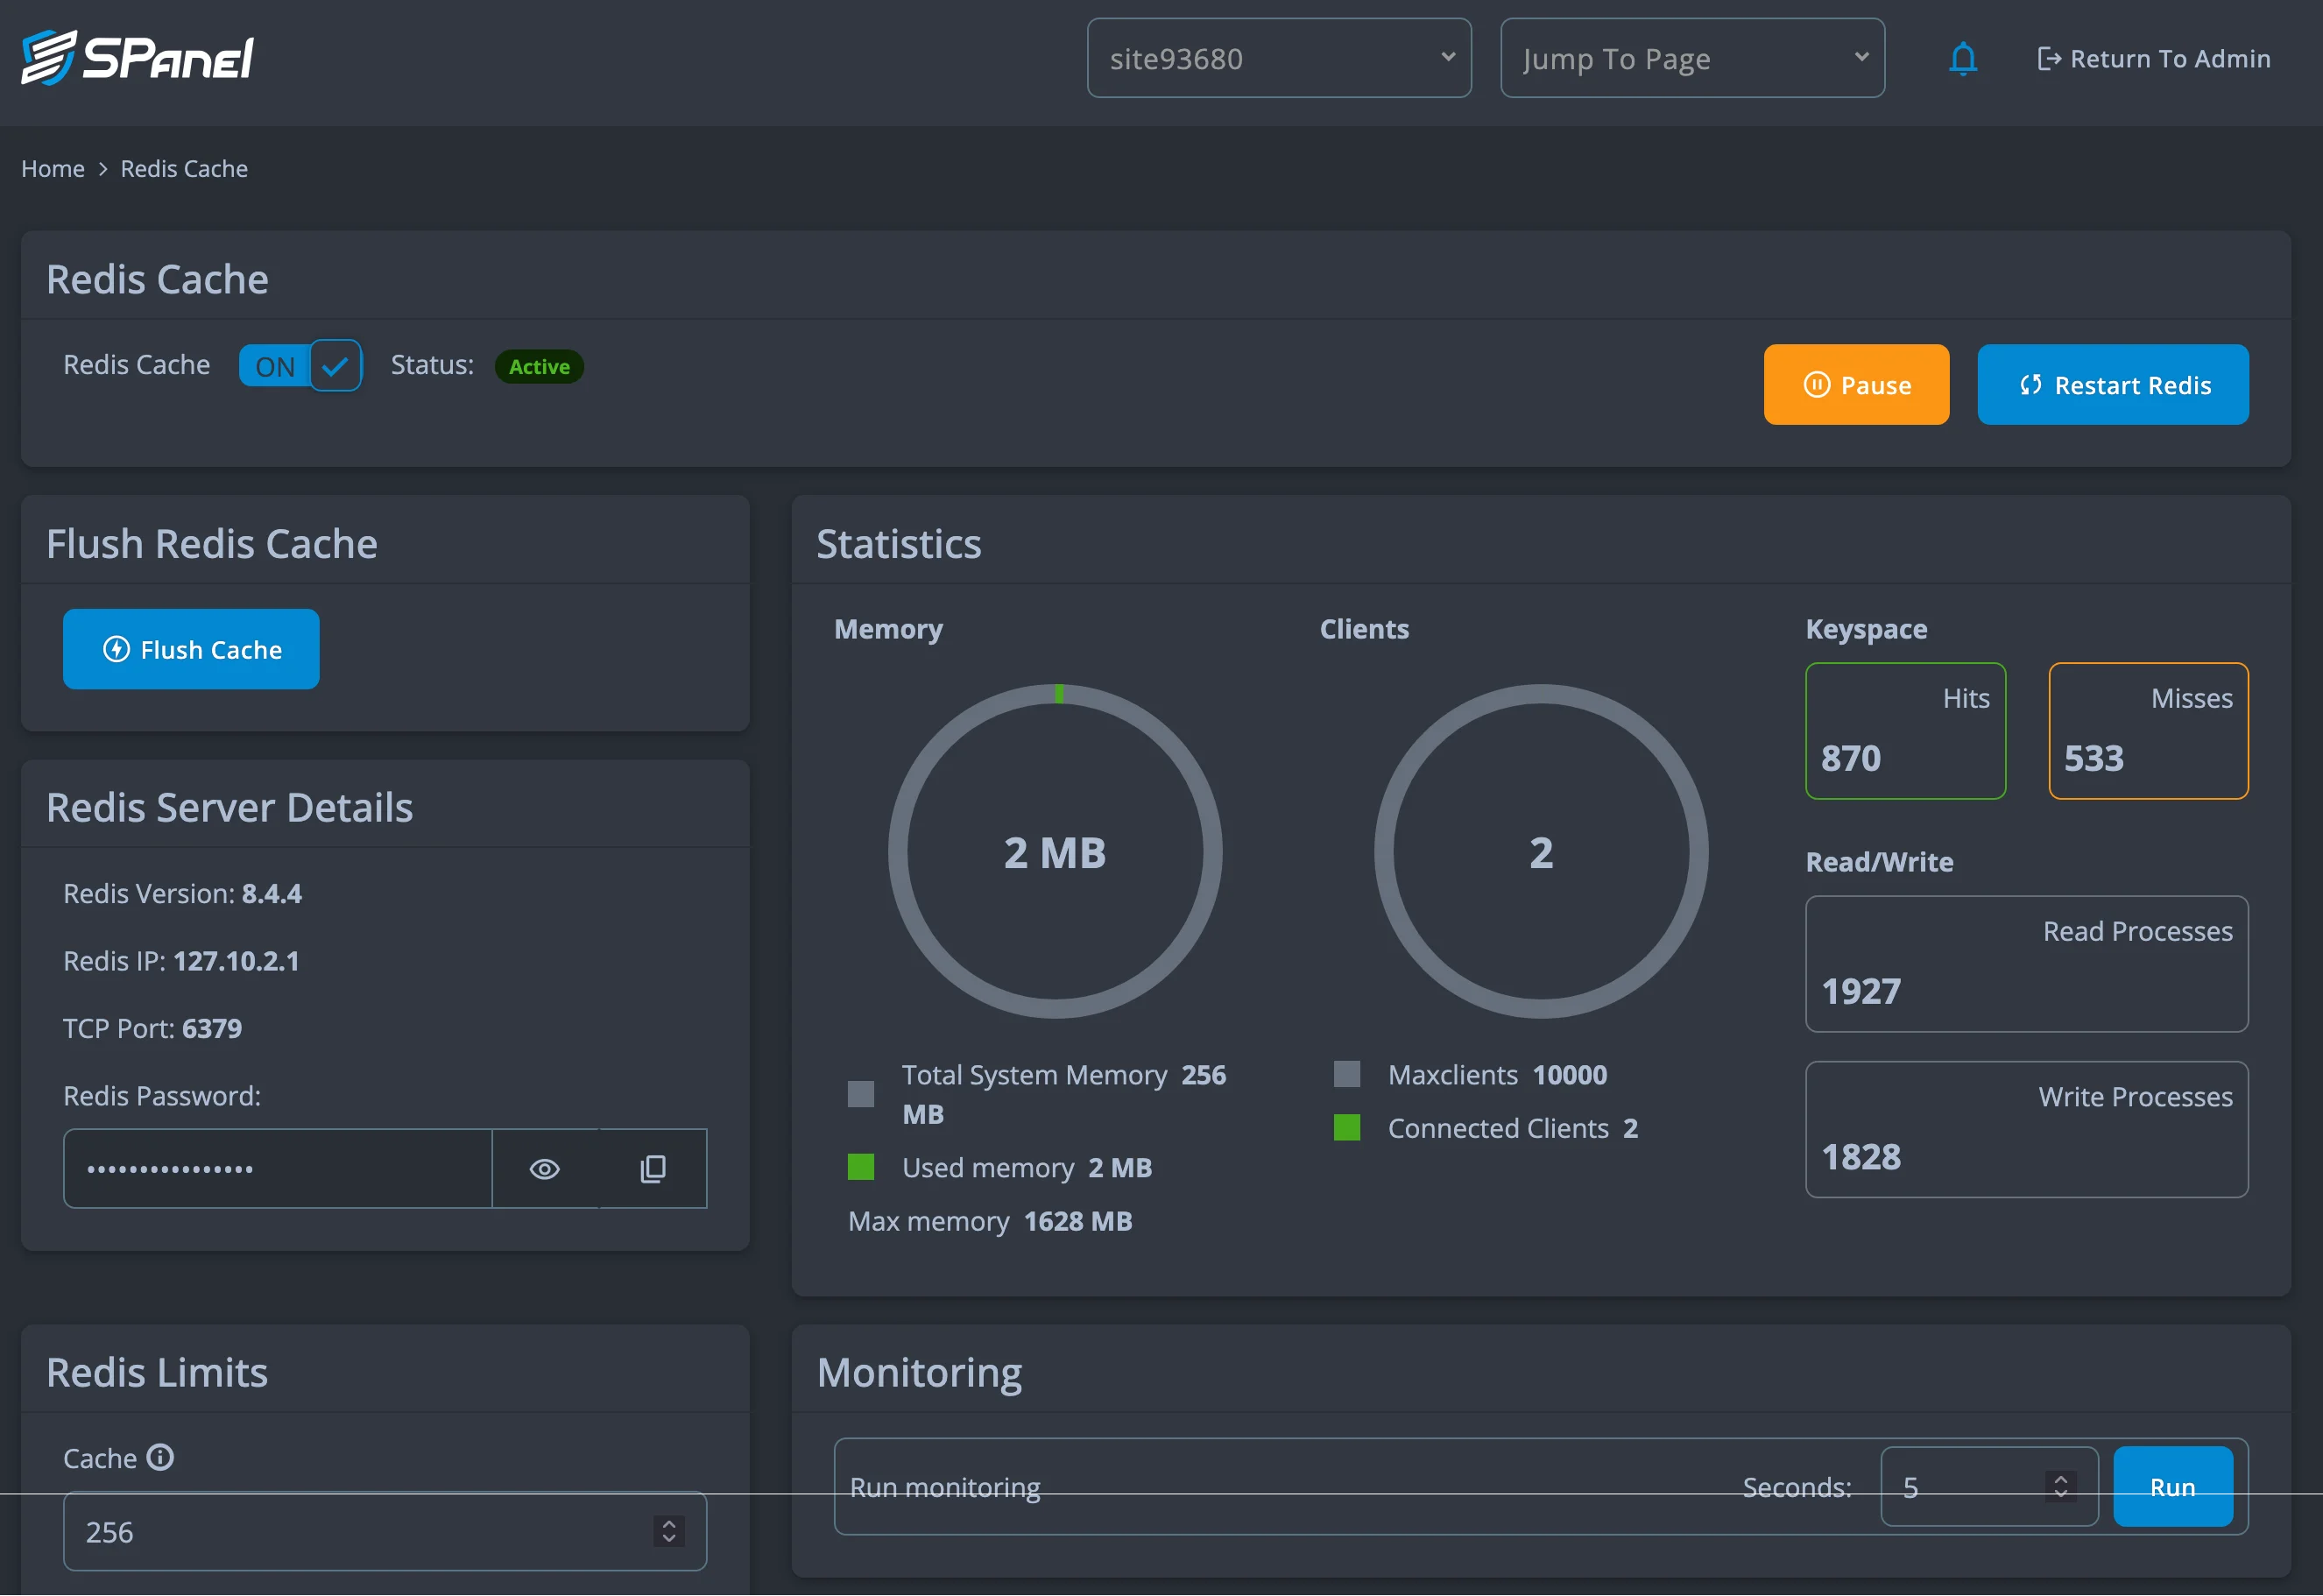
Then I enabled the LiteSpeed Cache plugin and pointed its object cache at Redis (method: Redis, host 127.10.2.1:6379) — the built-in connection test passed immediately. SPanel's dedicated Redis Cache panel confirmed Redis was live (v8.4.4) and already serving keyspace hits. The server now reported LiteSpeed as the web server, with OPcache running at a ~96% hit rate.
Load tests: the P95 problem essentially disappears
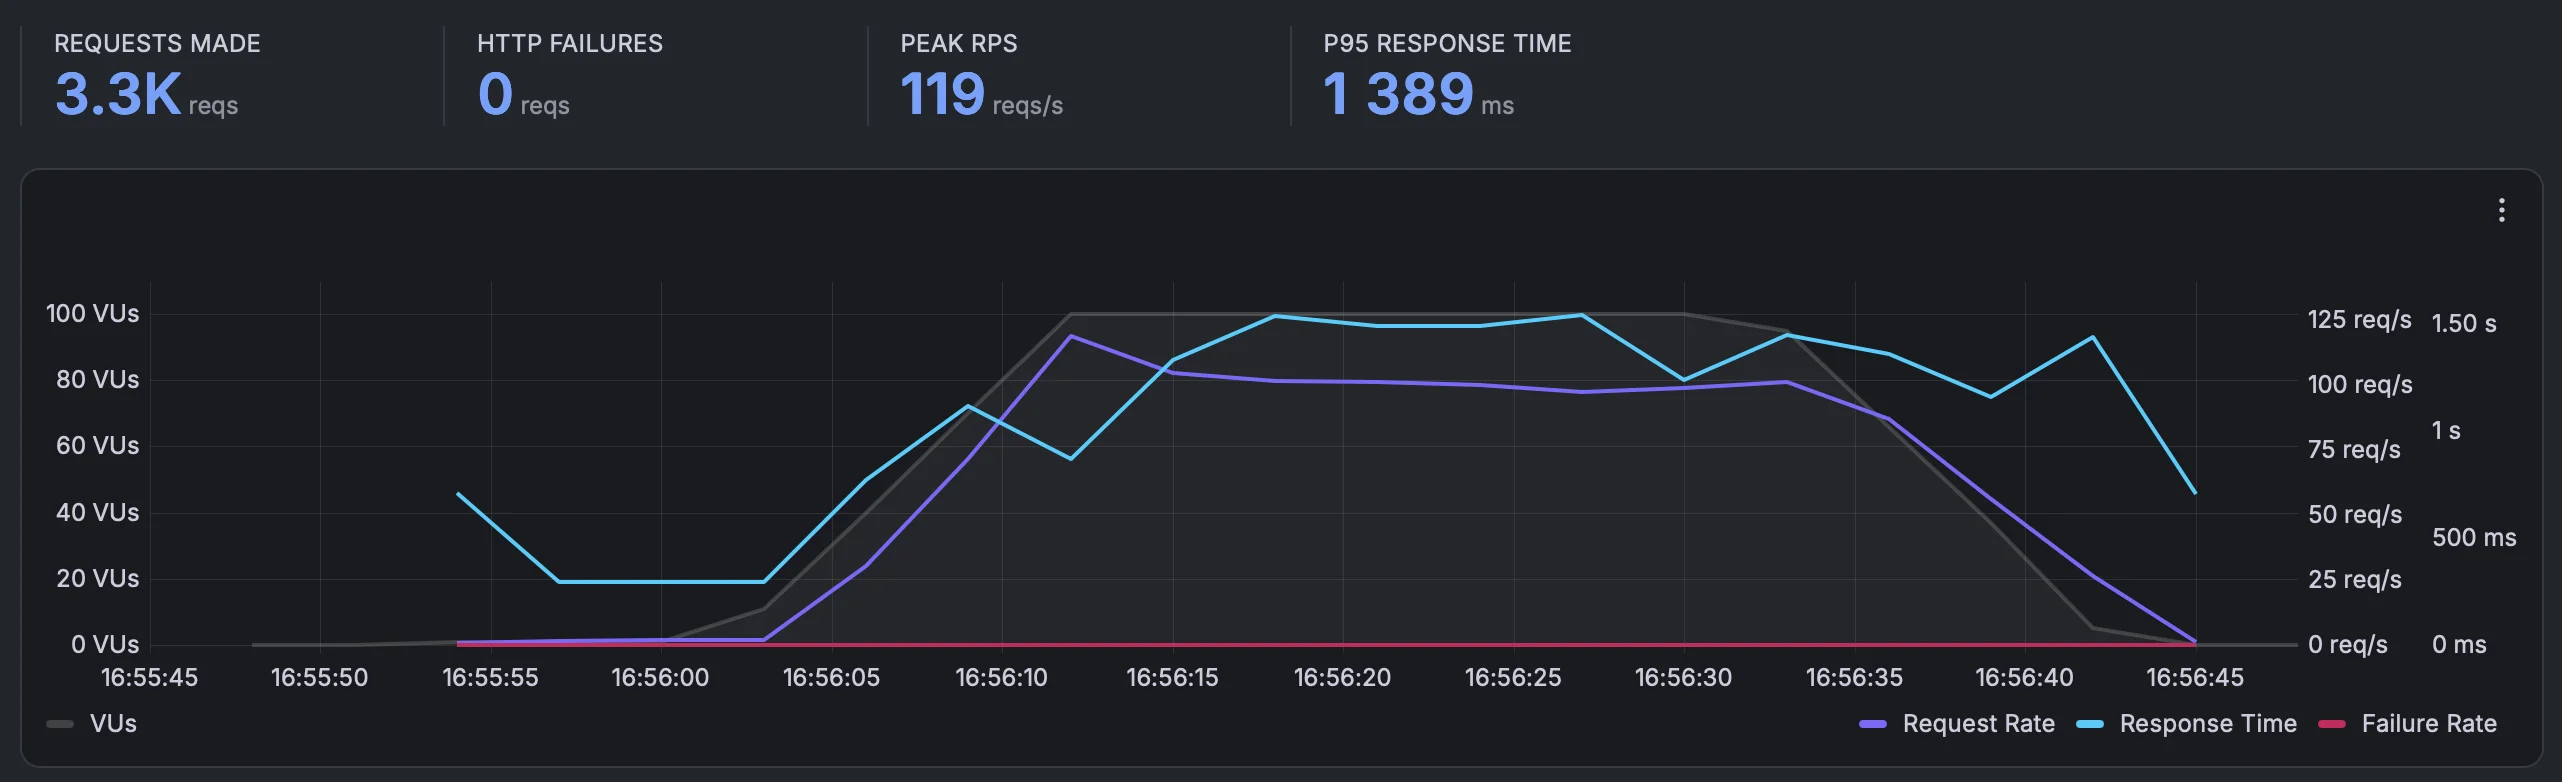
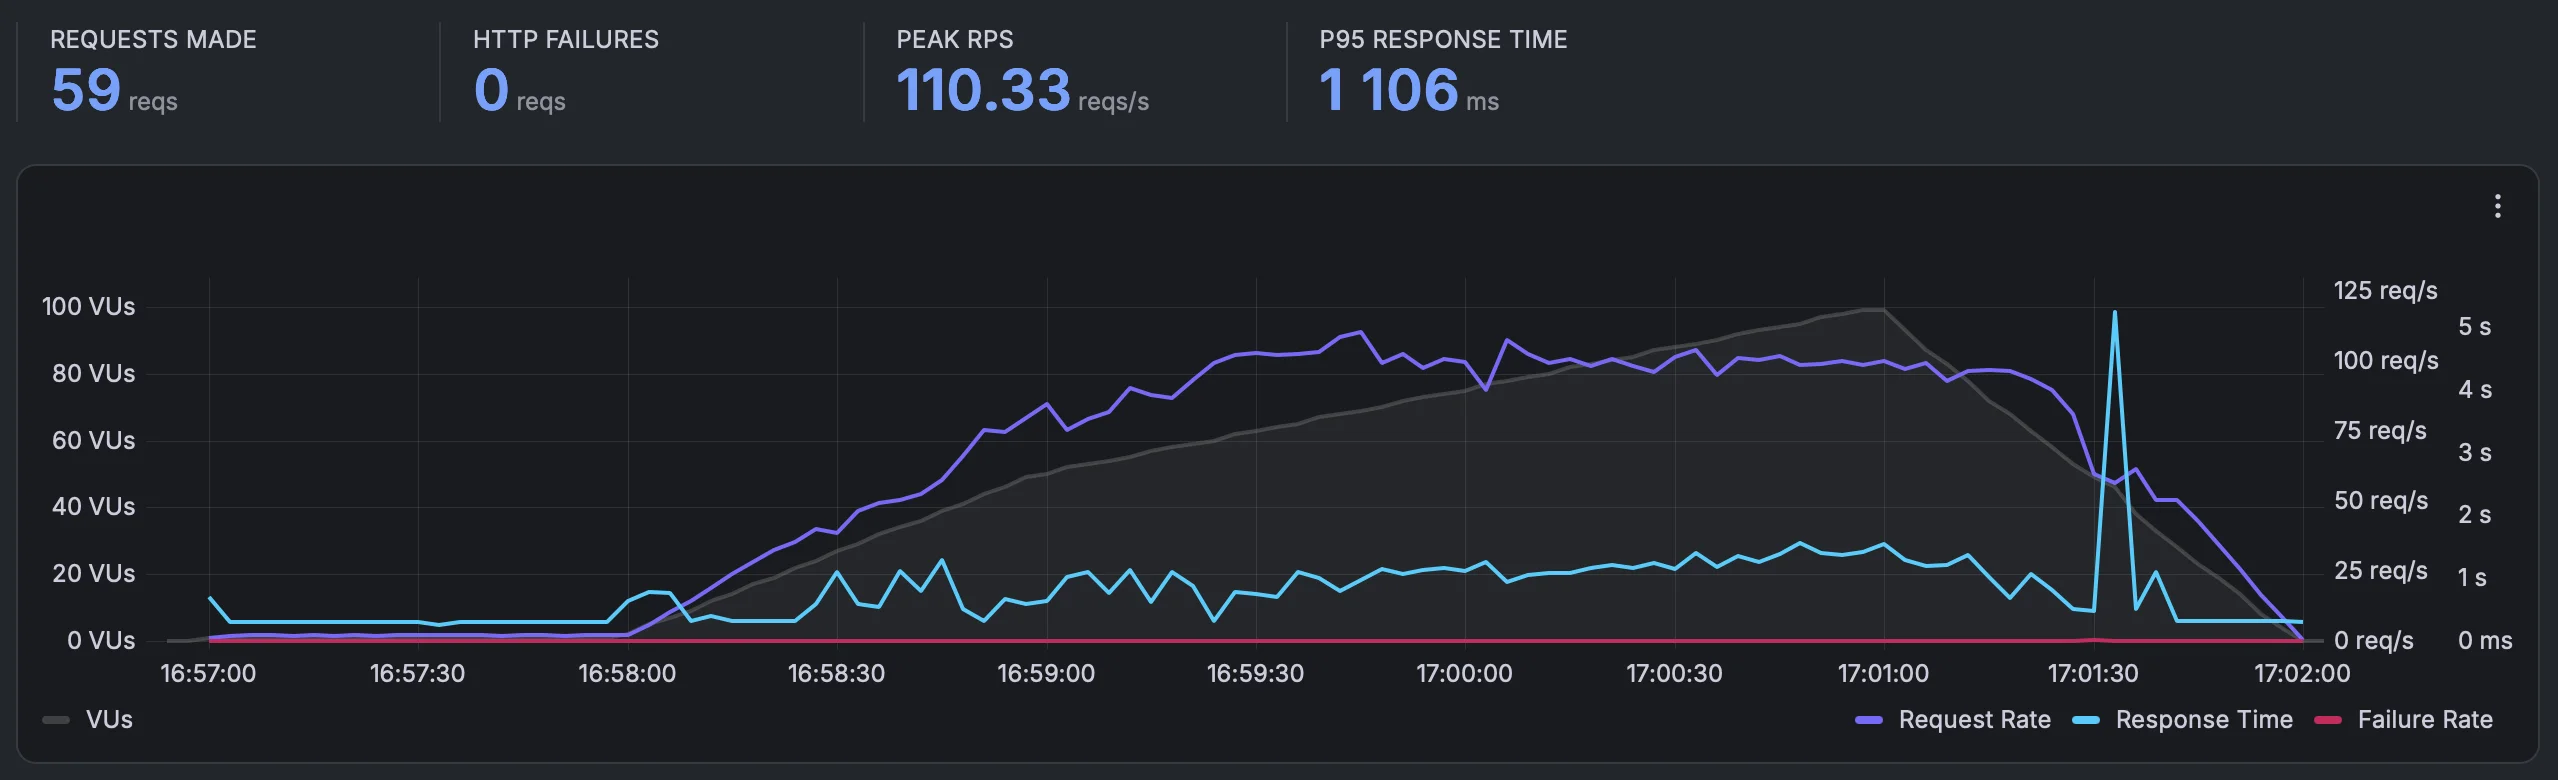
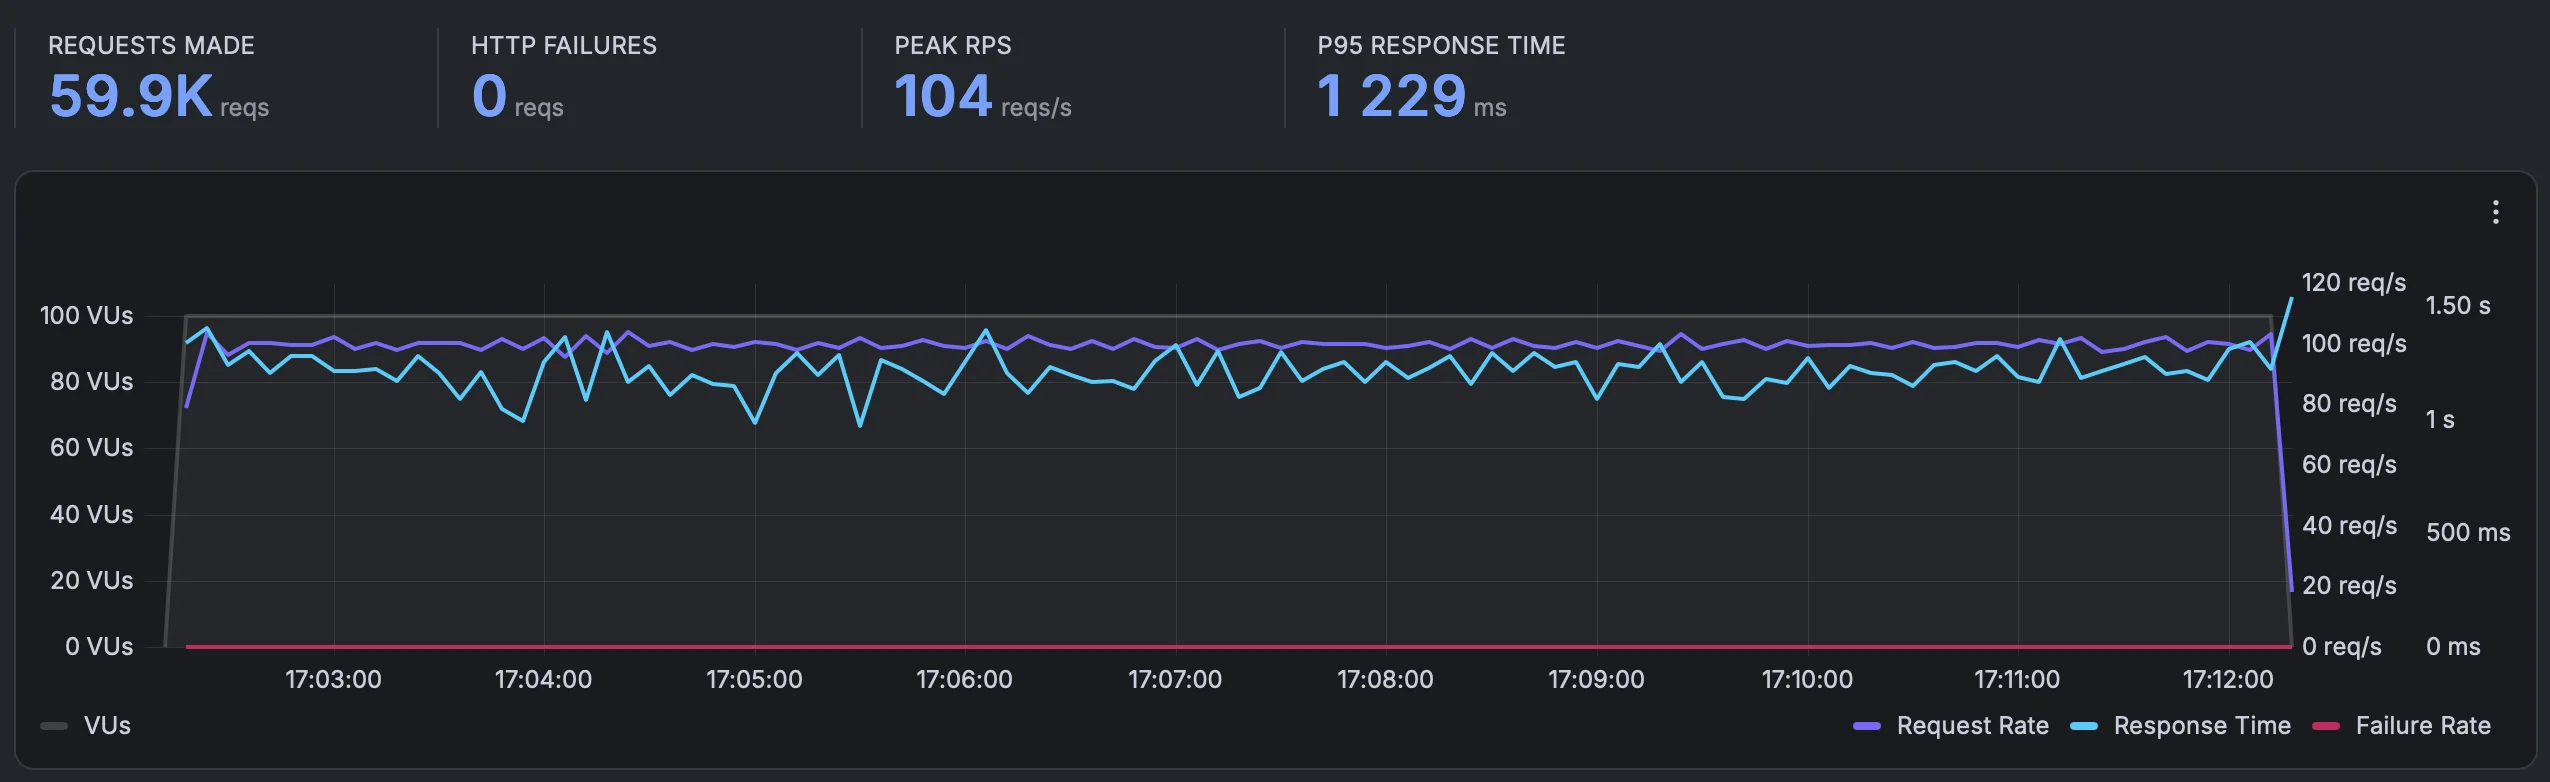
This is the headline. On the tuned stack the WooCommerce shop behaved like a different machine. P95 response time under load fell from 15–25 seconds to roughly 1.1–1.4 seconds — a ~15–20× improvement — while peak throughput jumped about 5× and the failure rate stayed at zero. The sustained run pushed 59,900 requests through the shop with no failures, versus 1,300 on the baseline.
| WooCommerce scenario | Apache baseline (P95 / peak RPS / failures) | LiteSpeed + LSCache + Redis (P95 / peak RPS / failures) |
|---|---|---|
| Spike | 18,212 ms / 20.3 RPS / 4 fails (302 req) | 1,389 ms / 119 RPS / 0 fails (3,300 req) |
| Ramp up/down | 18,153 ms / 23.0 RPS / 0 fails | 1,106 ms / 110 RPS / 0 fails |
| Sustained | 25,166 ms / 18.0 RPS / 0 fails (1,300 req) | 1,229 ms / 104 RPS / 0 fails (59,900 req) |
Why it changes so much
Query Monitor explains the collapse in latency. With the Redis object cache active, the 1,000-product WooCommerce homepage dropped from 106 database queries (0.0109 s) to just 9 (0.0004 s), and page generation fell from 0.32 s to 0.21 s — Query Monitor now reports a "persistent object cache plugin in use." On top of that, LSCache serves the full page from cache for repeat hits, so the overwhelming majority of load-test requests never touch PHP or MySQL at all. That's exactly why P95 falls off a cliff under sustained traffic.

| WooCommerce metric | Apache baseline | LiteSpeed + LSCache + Redis |
|---|---|---|
| Page generation | 0.3223 s | 0.2111 s |
| DB queries / time | 106 / 0.0109 s | 9 / 0.0004 s |
| Object cache | Redis installed, not used | Redis object cache active |
| WP Benchmark server score | 7.9 | 8.1 |
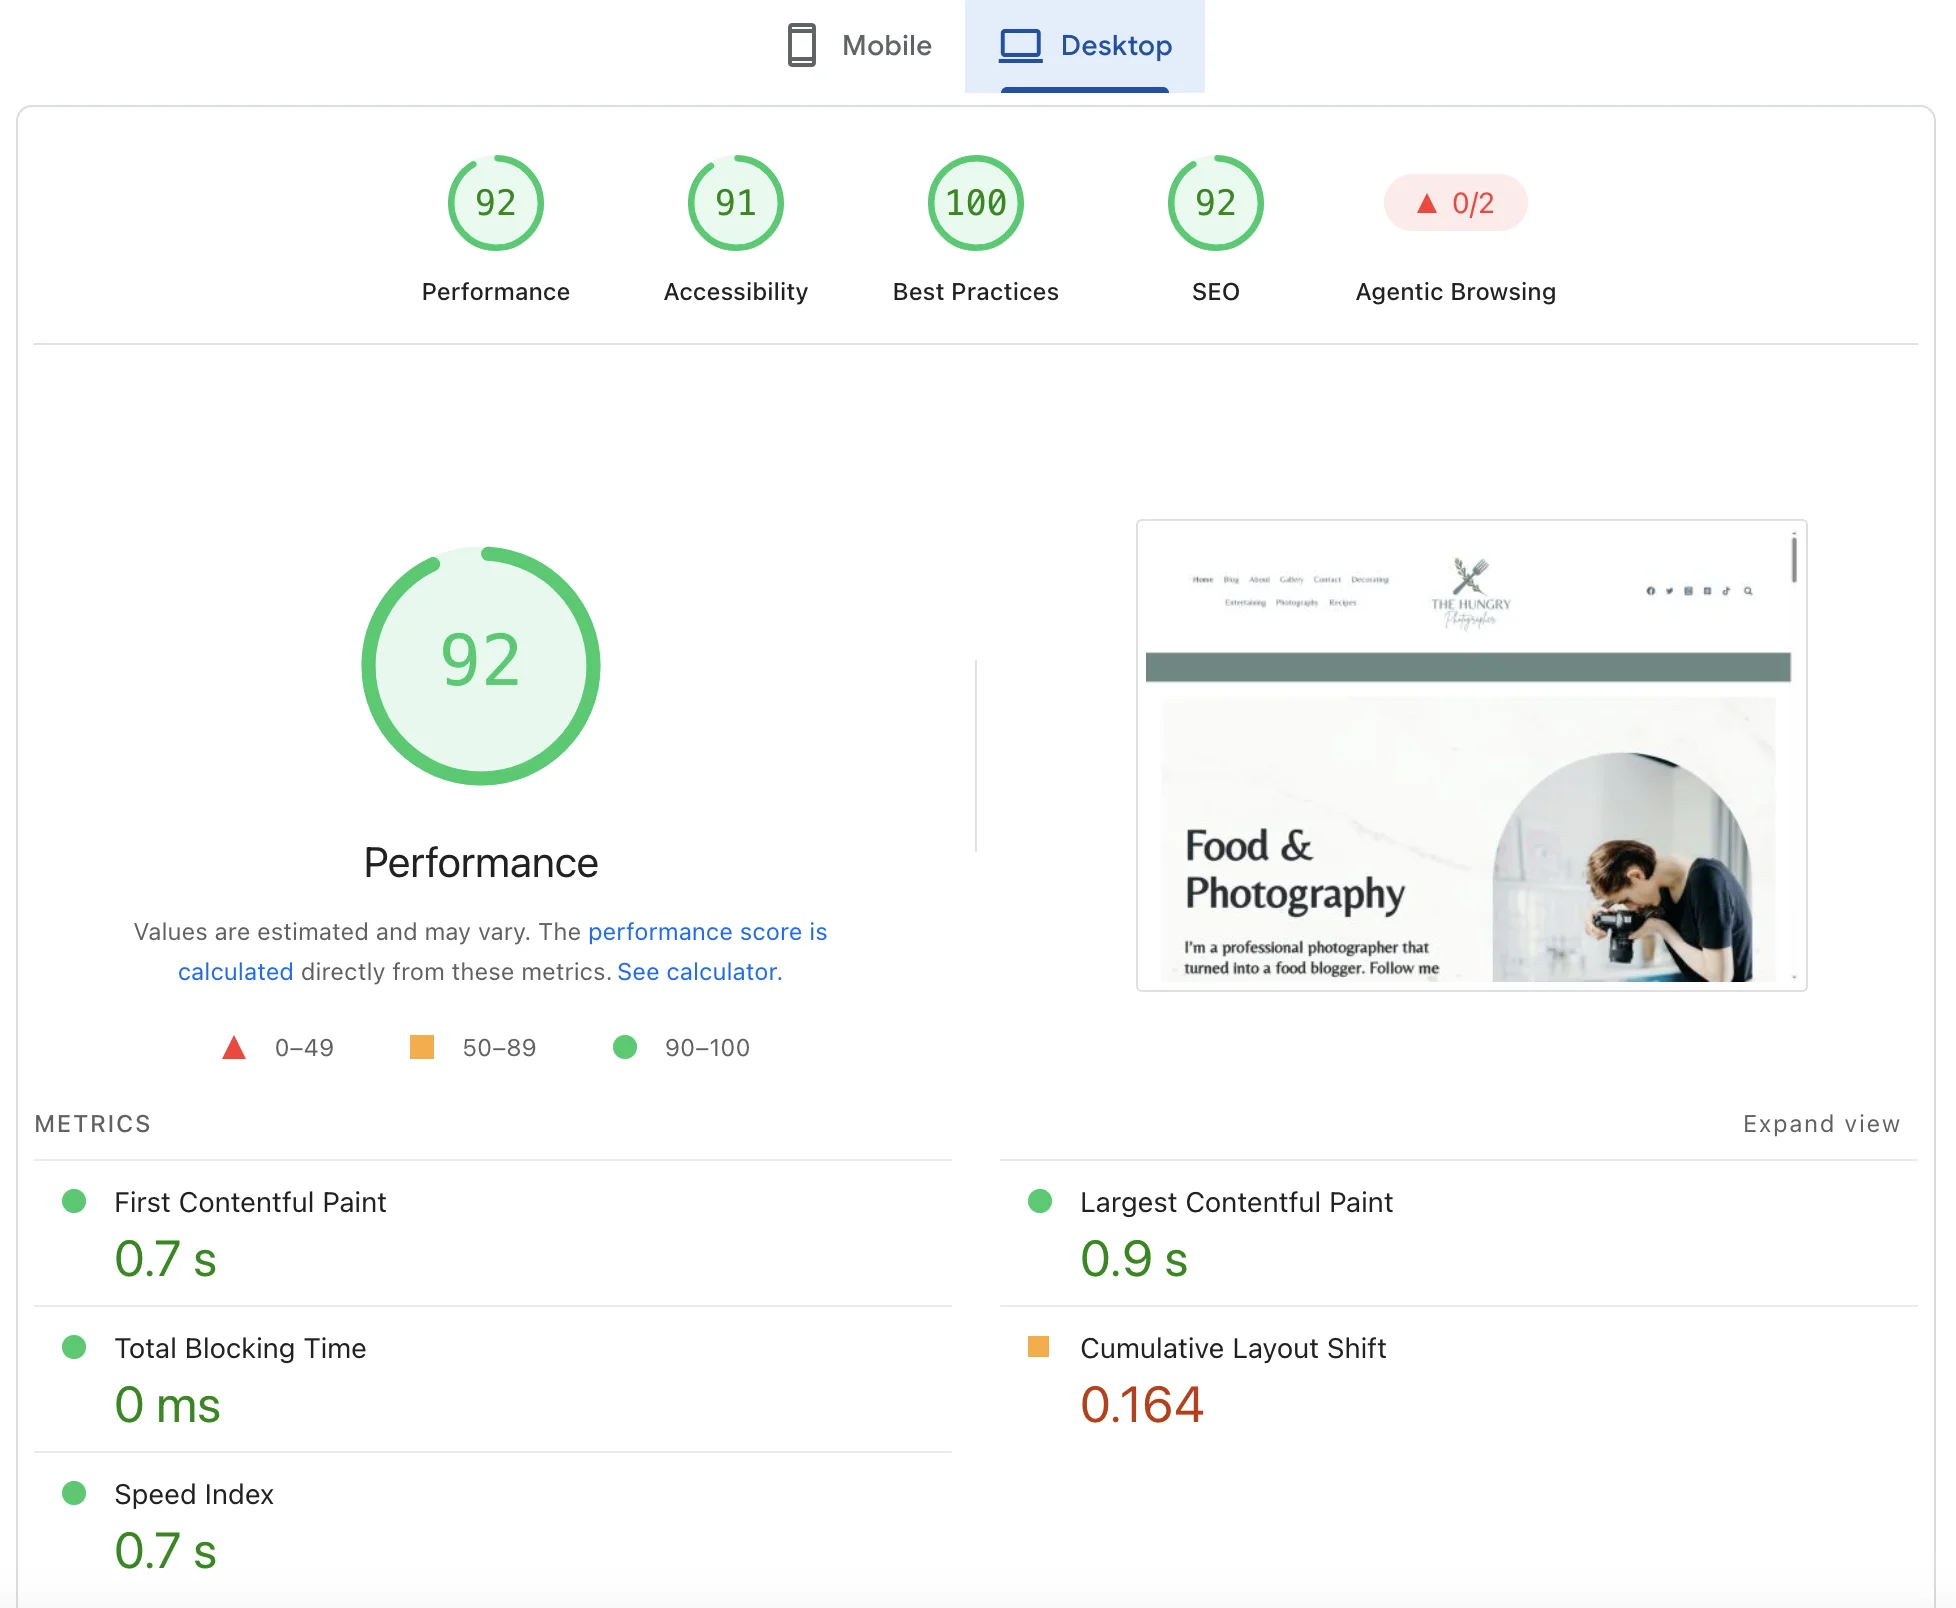
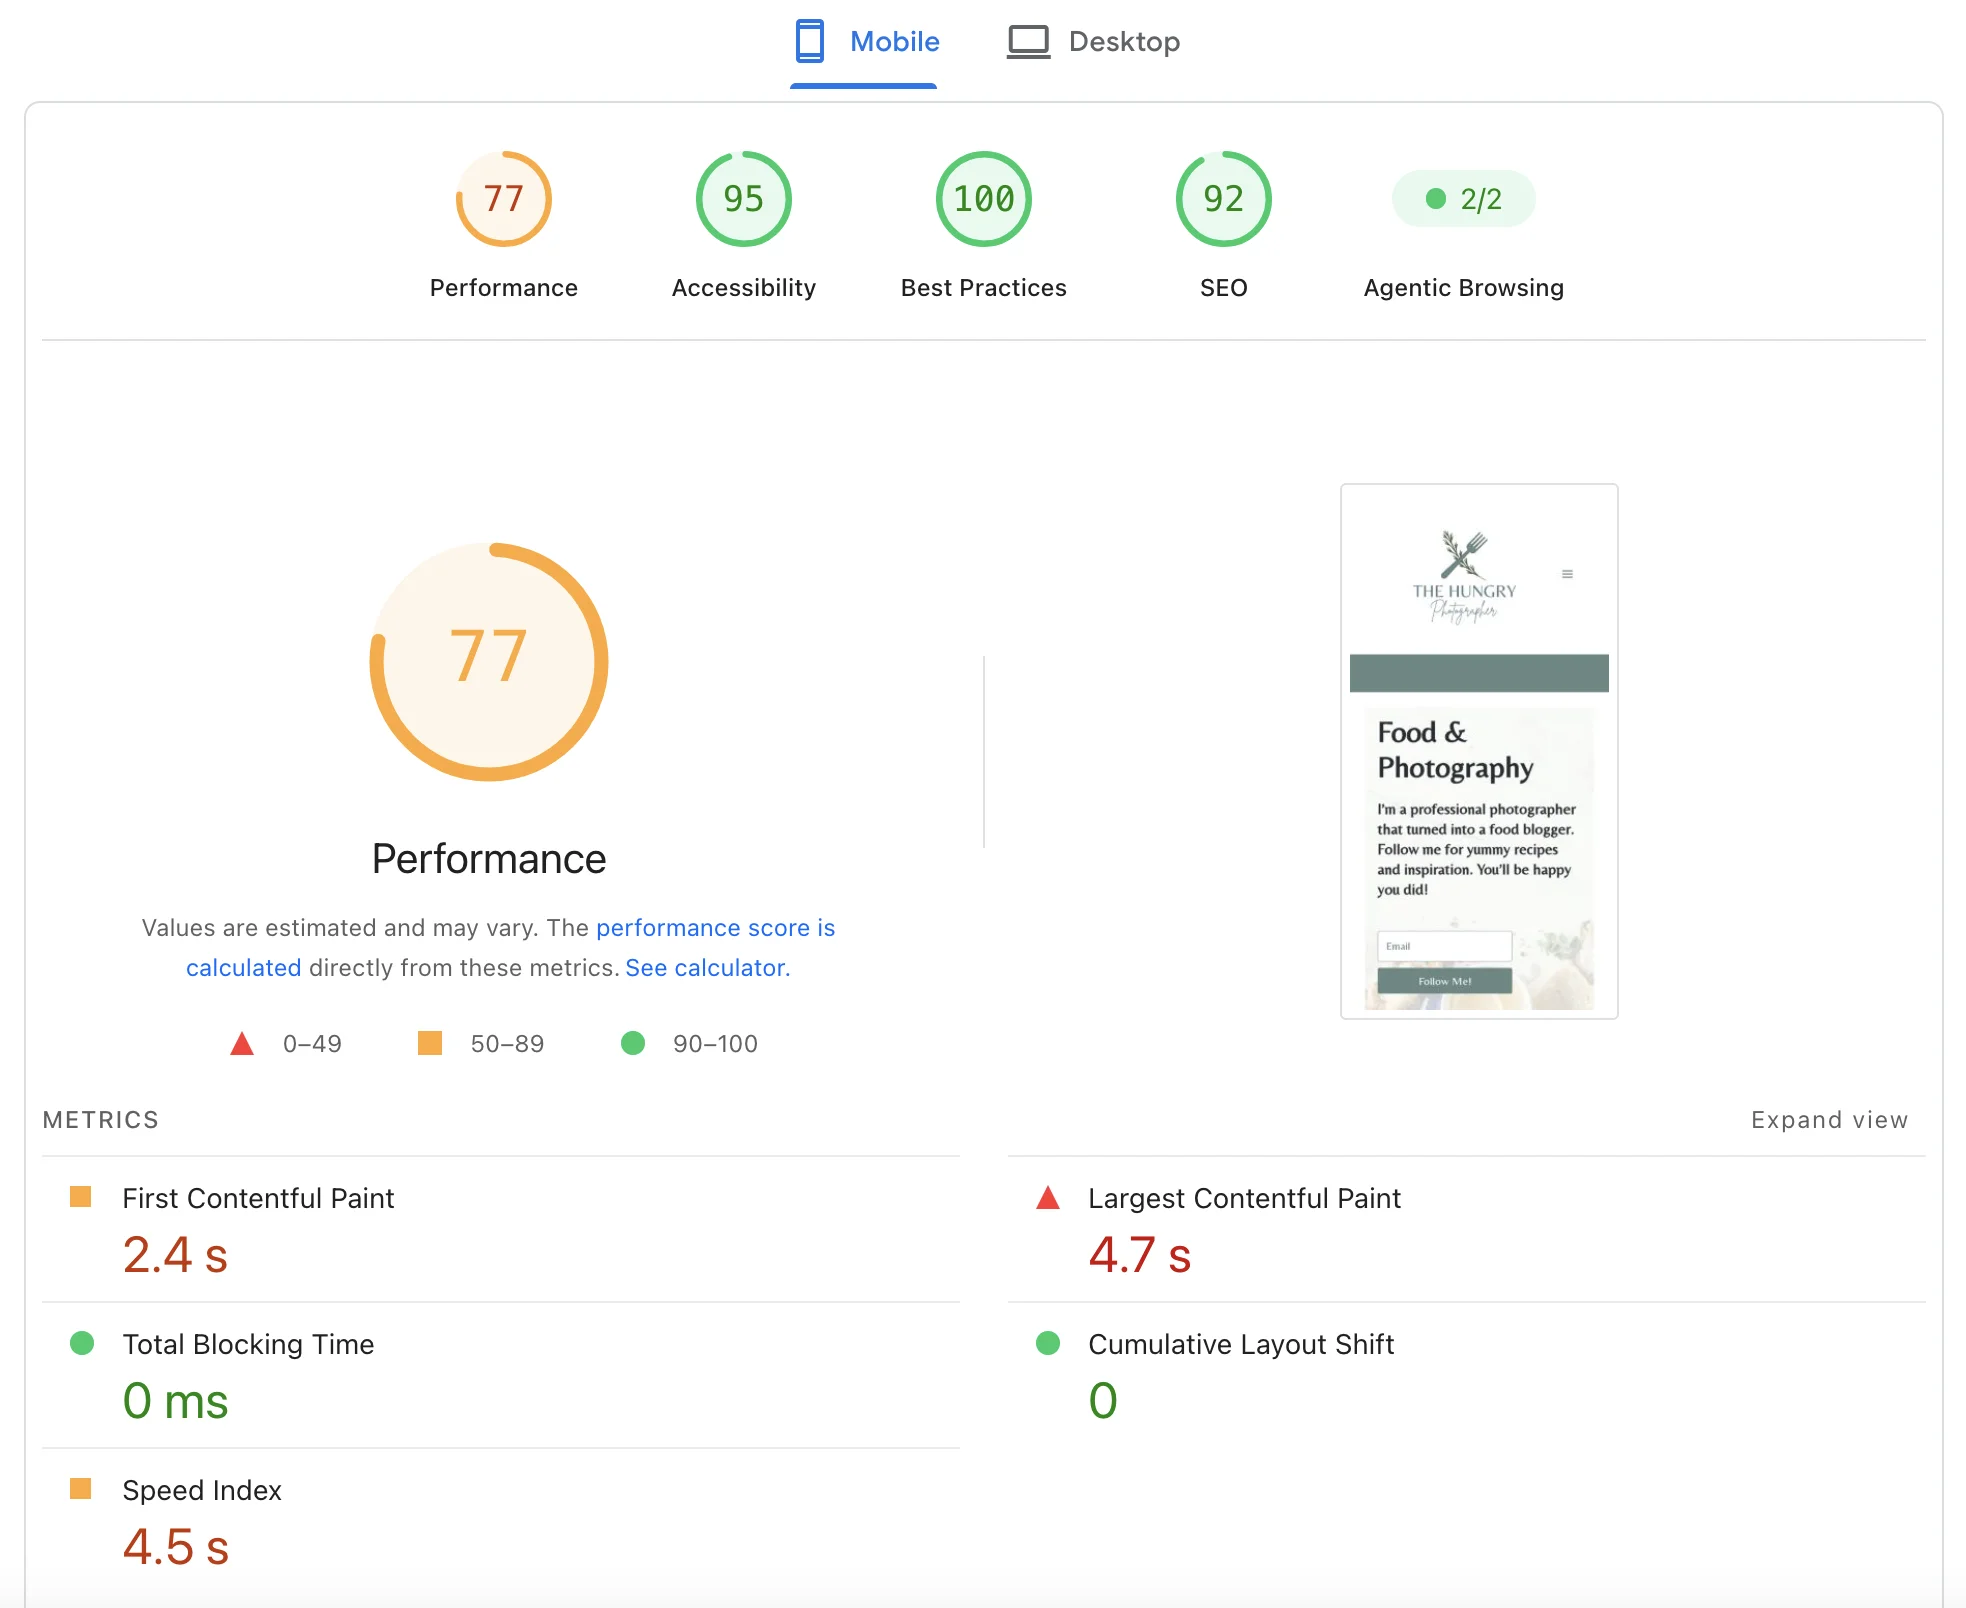
| PageSpeed desktop (perf / LCP) | 90 / 1.2 s | 92 / 0.9 s |
| PageSpeed mobile (perf / LCP) | 69 / 5.0 s | 77 / 4.7 s |
The synthetic SpeedTest Pro figures and raw network throughput were essentially unchanged, which is exactly what you'd expect — those measure uncached PHP/MySQL operations and the network, neither of which caching touches.
The takeaway: this is the configuration the product is actually meant to run in, and it turns the one genuine caveat from my baseline — P95 latency stretching under sustained load — into a non-issue. So the advice for buyers is concrete: on the Entry Cloud box, switch to OpenLiteSpeed and enable LSCache plus the Redis object cache from the start (a few clicks in SPanel), and the 2-core entry plan comfortably absorbs heavy, bursty WooCommerce traffic. My baseline numbers above stand as the "out-of-the-box Apache" picture; these are the tuned-stack result — and the tuned stack is the one to run.
Strengths
- Zero dropped requests under load — 0 failures across spike, ramp and sustained tests (16,000 requests on the sustained clean run); no aggressive rate-limiting getting in the way.
- Fast real-world page generation — 0.05 s clean, 0.32 s for a 1,000-product WooCommerce page, with 106 DB queries in 0.011 s and no external HTTP API drag.
- MySQL well above average — 0.74–1.33 s vs a 2.9 s industry average.
- Excellent large-file throughput — ~47–53 MB/s download, well above the ~10 MB/s average.
- SPanel — a polished in-house control panel with no per-account licensing, WordPress-first onboarding, and admin/user separation I'd happily hand to a client.
- Security and extras on by default — SShield, free SSL, free migration, daily backups and a 99.99% SLA included, not bolted-on paid extras.
- Broad data-center choice — 24 locations worldwide (own DCs in Sofia and the US, plus Integrated Cloud and AWS regions across Europe, North America and Asia-Pacific), so you can pick one close to your users; I tested the EU (Sofia) node.
Weaknesses
- P95 latency grows sharply under sustained load on the un-tuned (Apache) box — 15–25 s at P95 on the blog/shop on the default stack. Switching to OpenLiteSpeed with LSCache and the Redis object cache resolves it (WooCommerce P95 ~1.1–1.4 s in the tuned re-test above); the real caveat is that it isn't the default.
- LSCache and Redis aren't on by default — they're installed and a few clicks away in SPanel, but until you switch to OpenLiteSpeed and enable them (which the re-test above shows is well worth it) you're on the slower Apache baseline.
- Entry resources are modest — 2 vCPU / 2 GB / 50 GB is fine for small sites but you'll outgrow it for a high-traffic shop; real value shows on larger builds.
- Mobile PageSpeed depends on the site — the host is fast, but unoptimised images on content-heavy pages push mobile LCP up.
- Backup retention beyond daily is a paid add-on (3-day $6 / 7-day $15).
Who I'd recommend it to (and who I wouldn't)
I'd recommend it if you want a managed VPS without living in a terminal: SPanel and SShield do the heavy lifting, WordPress is one click, and the box handles real traffic without dropping requests. It suits agencies and freelancers who manage sites for clients (no per-account licensing, clean admin/user split), and anyone who wants dedicated resources with a data center close to their audience and room to scale the build up as they grow. The zero-failure load behaviour makes it a trustworthy home for a site that occasionally gets busy.
I'd think twice if you want the cheapest possible host for a single tiny site — a shared plan is cheaper — or if you're going to run a high-traffic, uncached WooCommerce shop on the entry config and expect snappy responses under load without adding caching or more cores. The performance is there, but on the 2-core plan you have to help it with caching.
Final verdict
The standout result is one most hosts can’t match: on the sustained load test ScalaHosting served 16,000 requests from a single IP with zero failures and no rate-limiting — the behaviour that separates a genuinely managed VPS from a shared box with a fancier label. Everything below is in service of that.
ScalaHosting's Entry Cloud is a genuinely managed cloud VPS that earns its keep through its own software — SPanel makes it approachable, SShield makes it safe by default, and the infrastructure delivered fast real-world pages and, most importantly, took every load test I threw at it without dropping requests. The honest limitation is that the entry config's two cores let P95 latency stretch under heavy uncached load, which is a resourcing-and-caching matter rather than a stability problem — the requests kept getting served. Switch to OpenLiteSpeed and turn on LSCache and the Redis object cache — the tuned re-test shows that P95-under-load caveat all but vanishes (WooCommerce P95 ~1.1–1.4 s) — then size the build to your traffic, and this is a strong, trustworthy platform.
| Category | Score |
|---|---|
| Price / value | 4 / 5 |
| Performance (PHP/MySQL) | 4 / 5 |
| Network & throughput | 4.5 / 5 |
| Stability under load | 4 / 5 |
| Onboarding & administration (SPanel) | 4.5 / 5 |
| Security & backups (SShield) | 4.5 / 5 |
| Support | 4.5 / 5 |
| Overall | 4.3 / 5 |
If you want a managed VPS where the control panel and security are built in rather than bolted on, and you value a host that keeps serving under pressure, ScalaHosting's Entry Cloud deserves a place on your shortlist — and the anytime money-back guarantee means you can put it through your own tests before committing.